In 2017, Champion Data had the rare opportunity to give new life to golf broadcast graphics, and the results were emulated through the worldwide market.
Client:
Asian Tour Golf
EMPLOYER:
Champion Data
CREDITS:
James Watson - Jarred Swire - Jerome Guzzo - Eugine Du Toit - Cameron Woolcock
This was quite an ambitious project, as the goal was to provide something fresh and different to the market of golf broadcast graphics.
Up until this point, most competitor graphics packages were large 3D-style graphics, often going years without change.
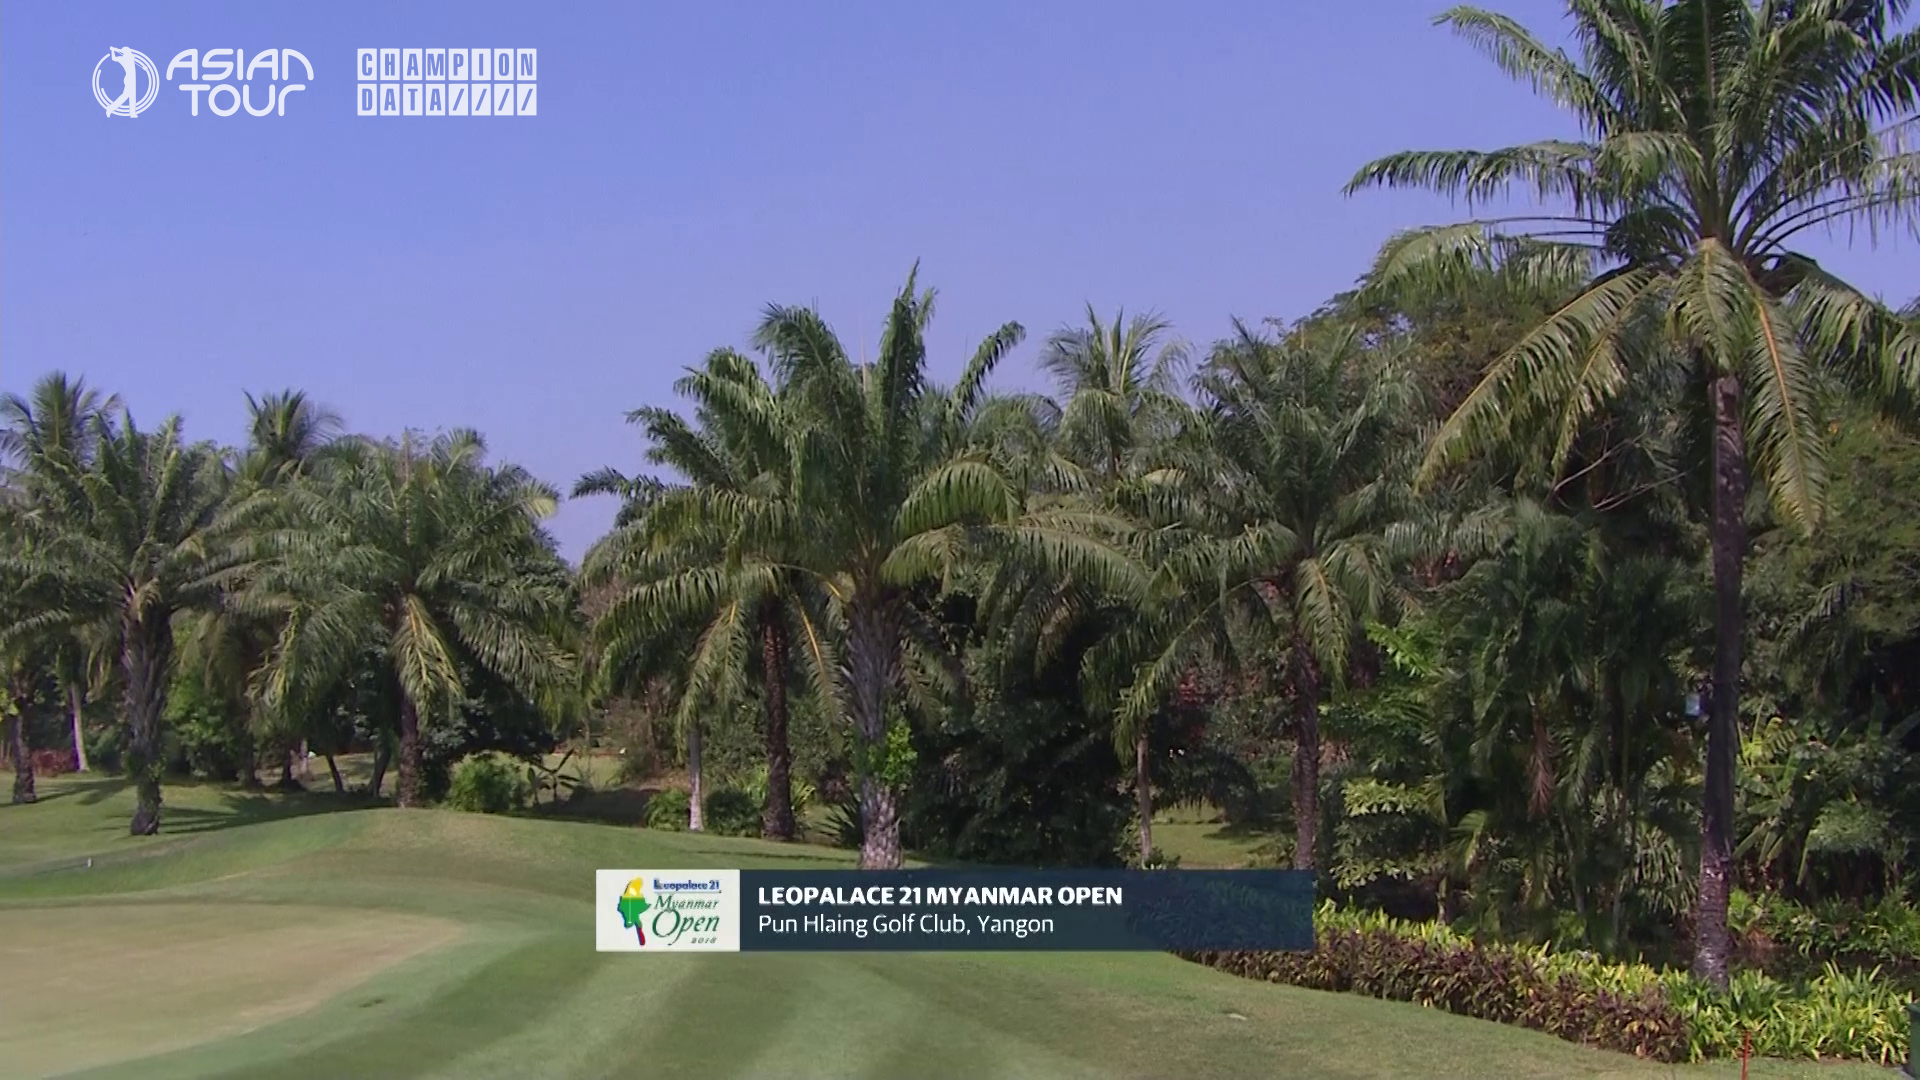
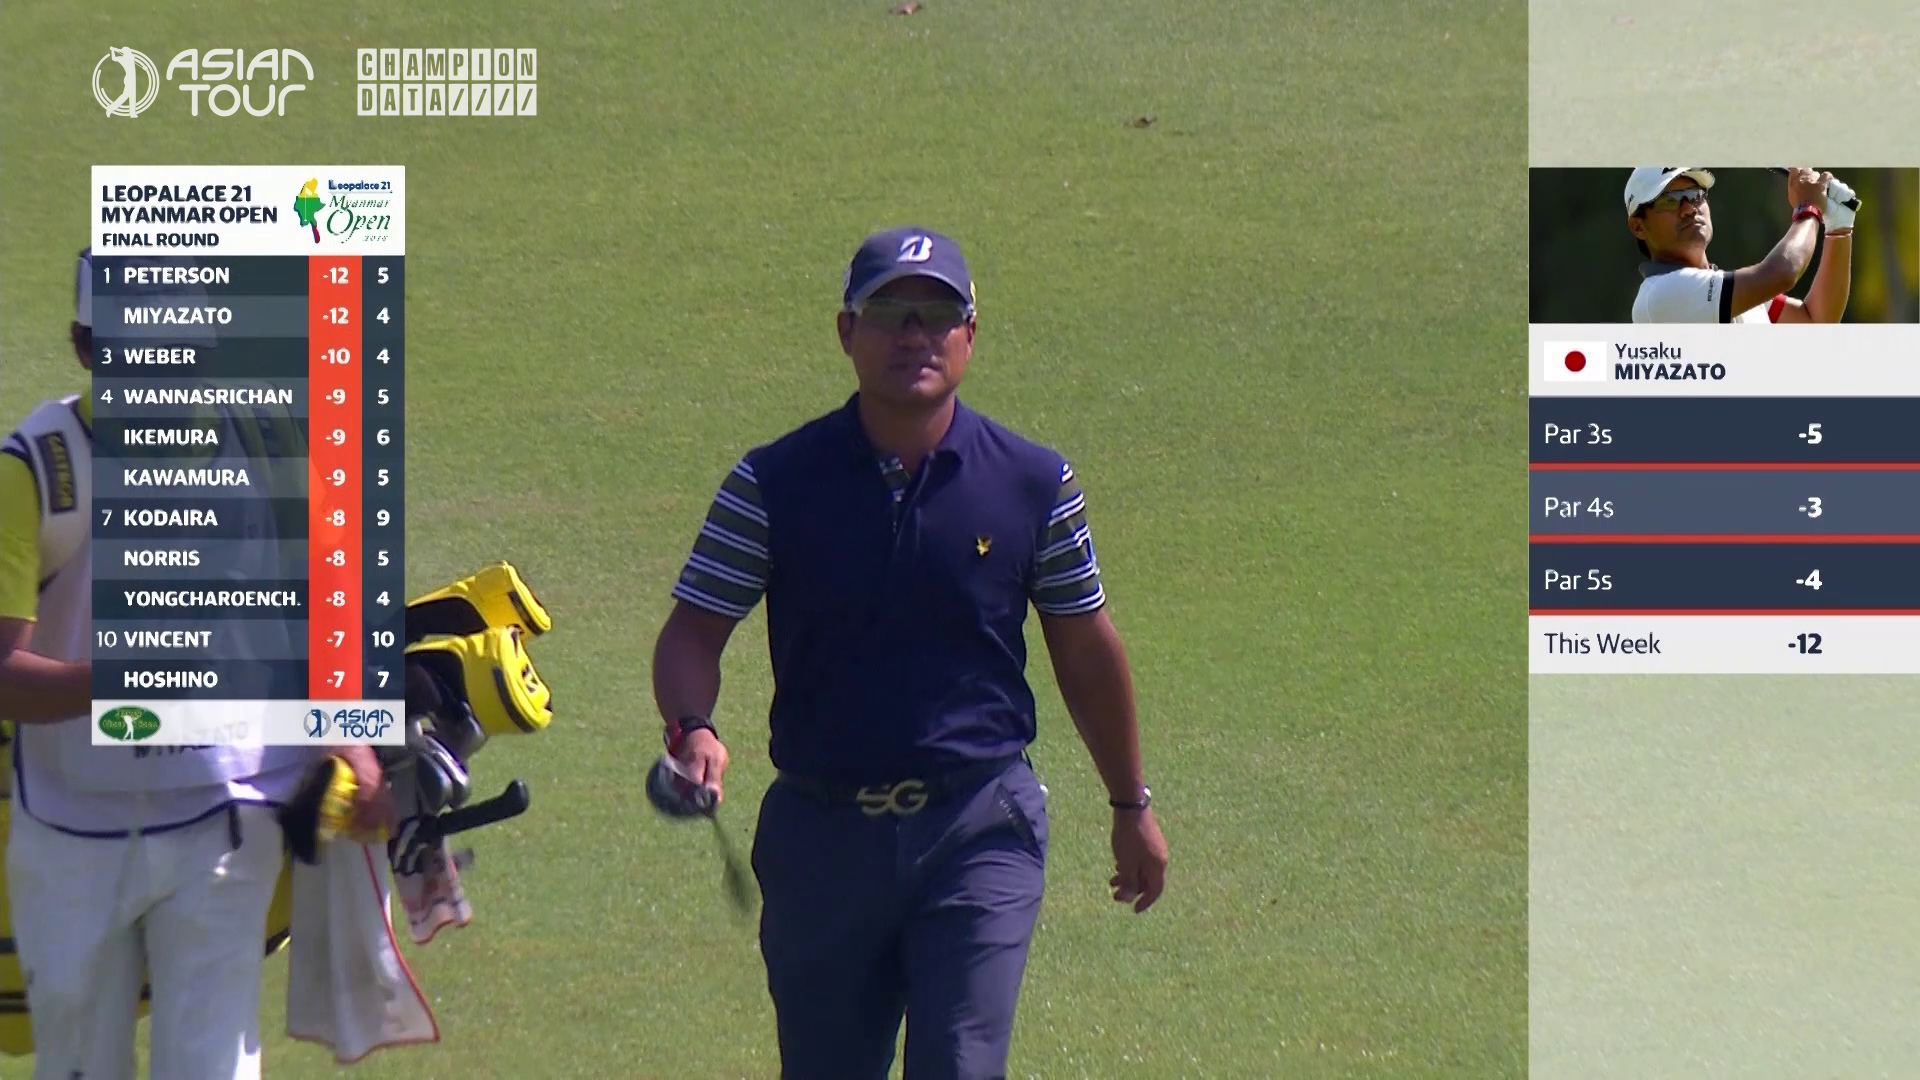
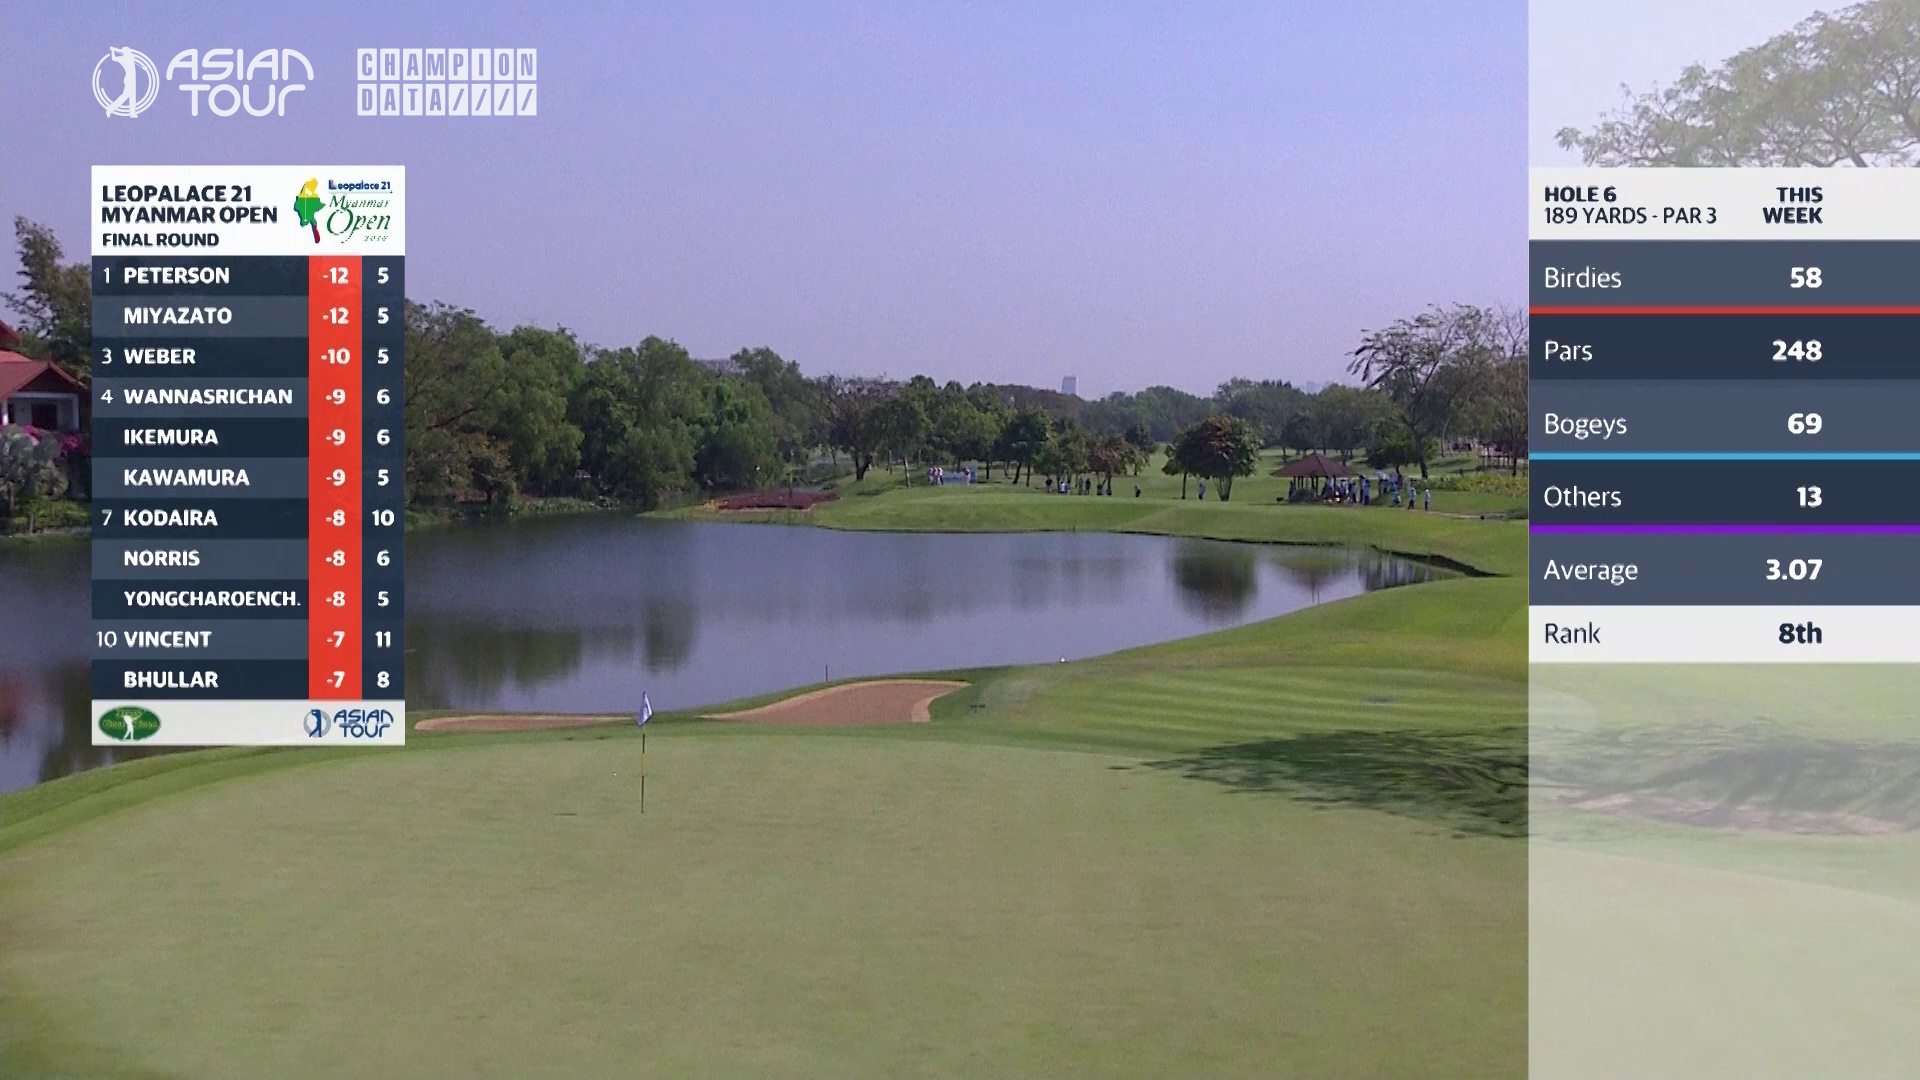
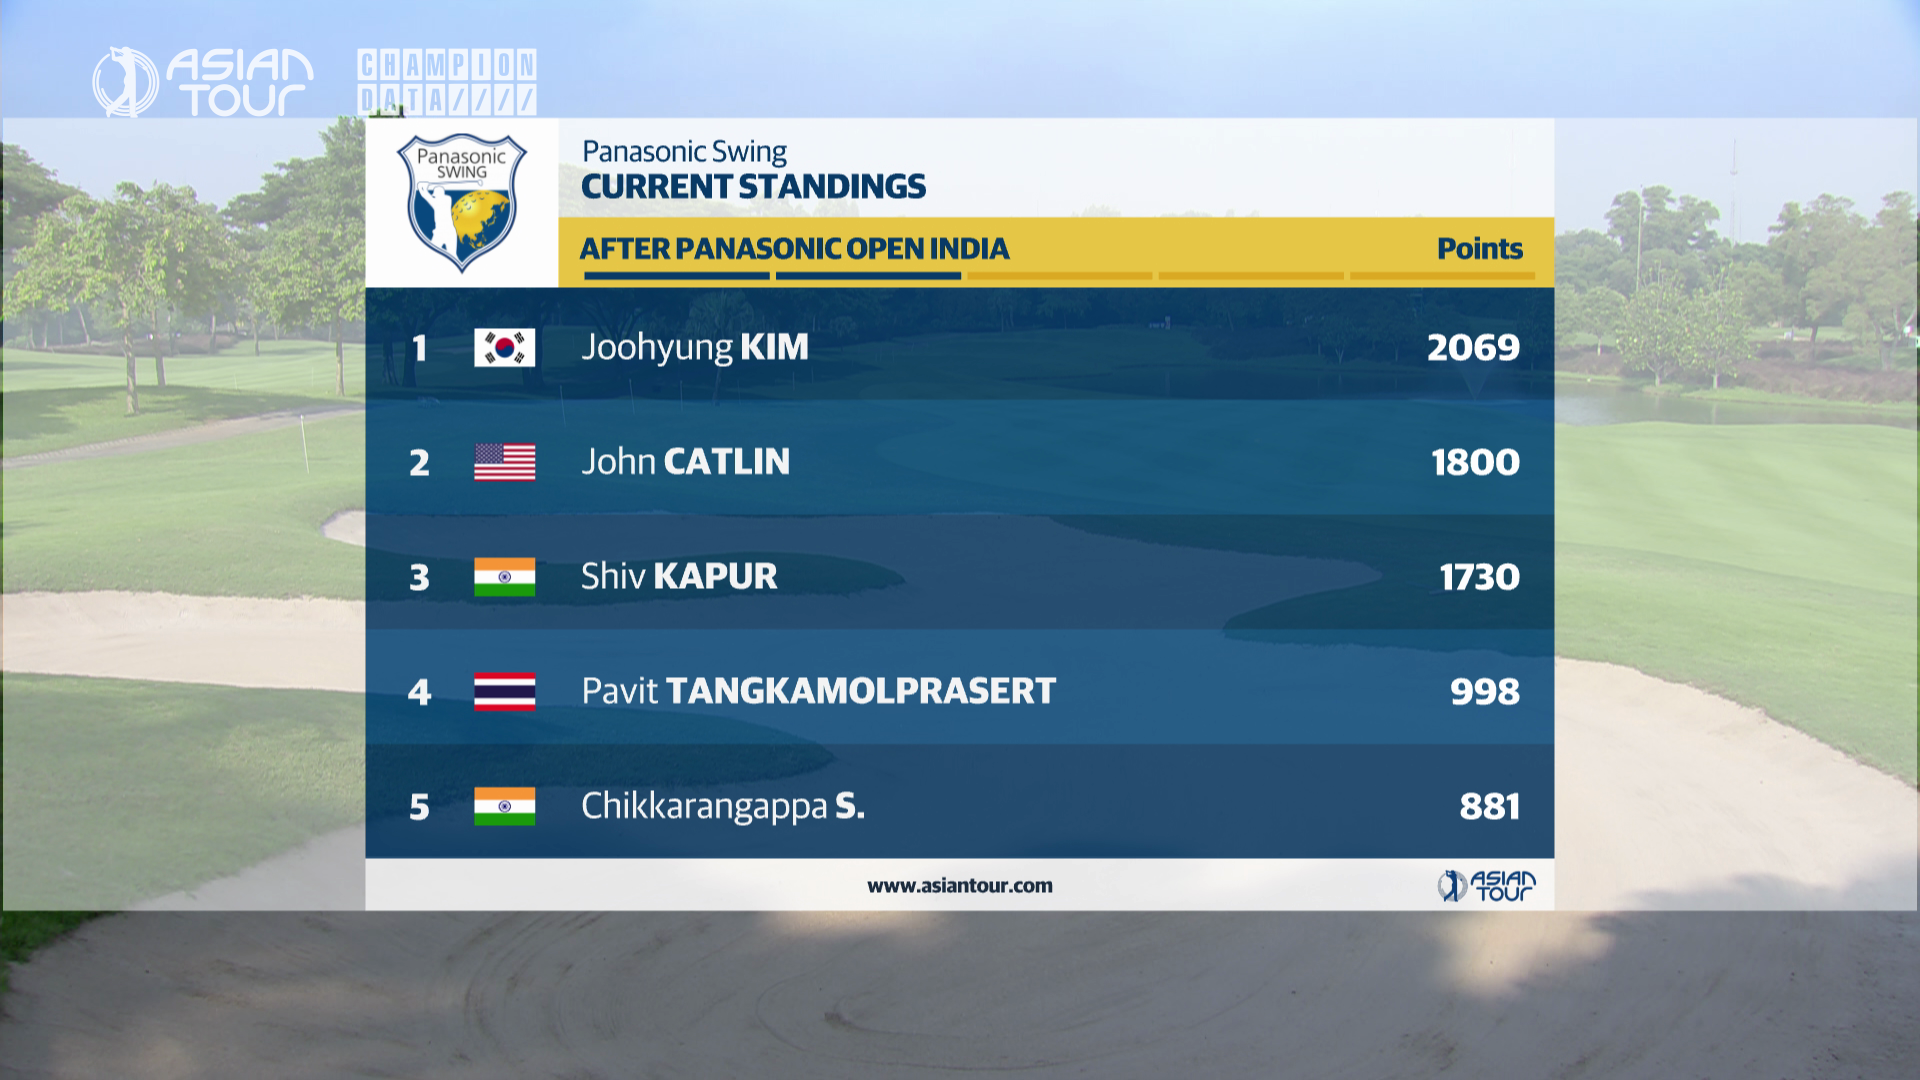
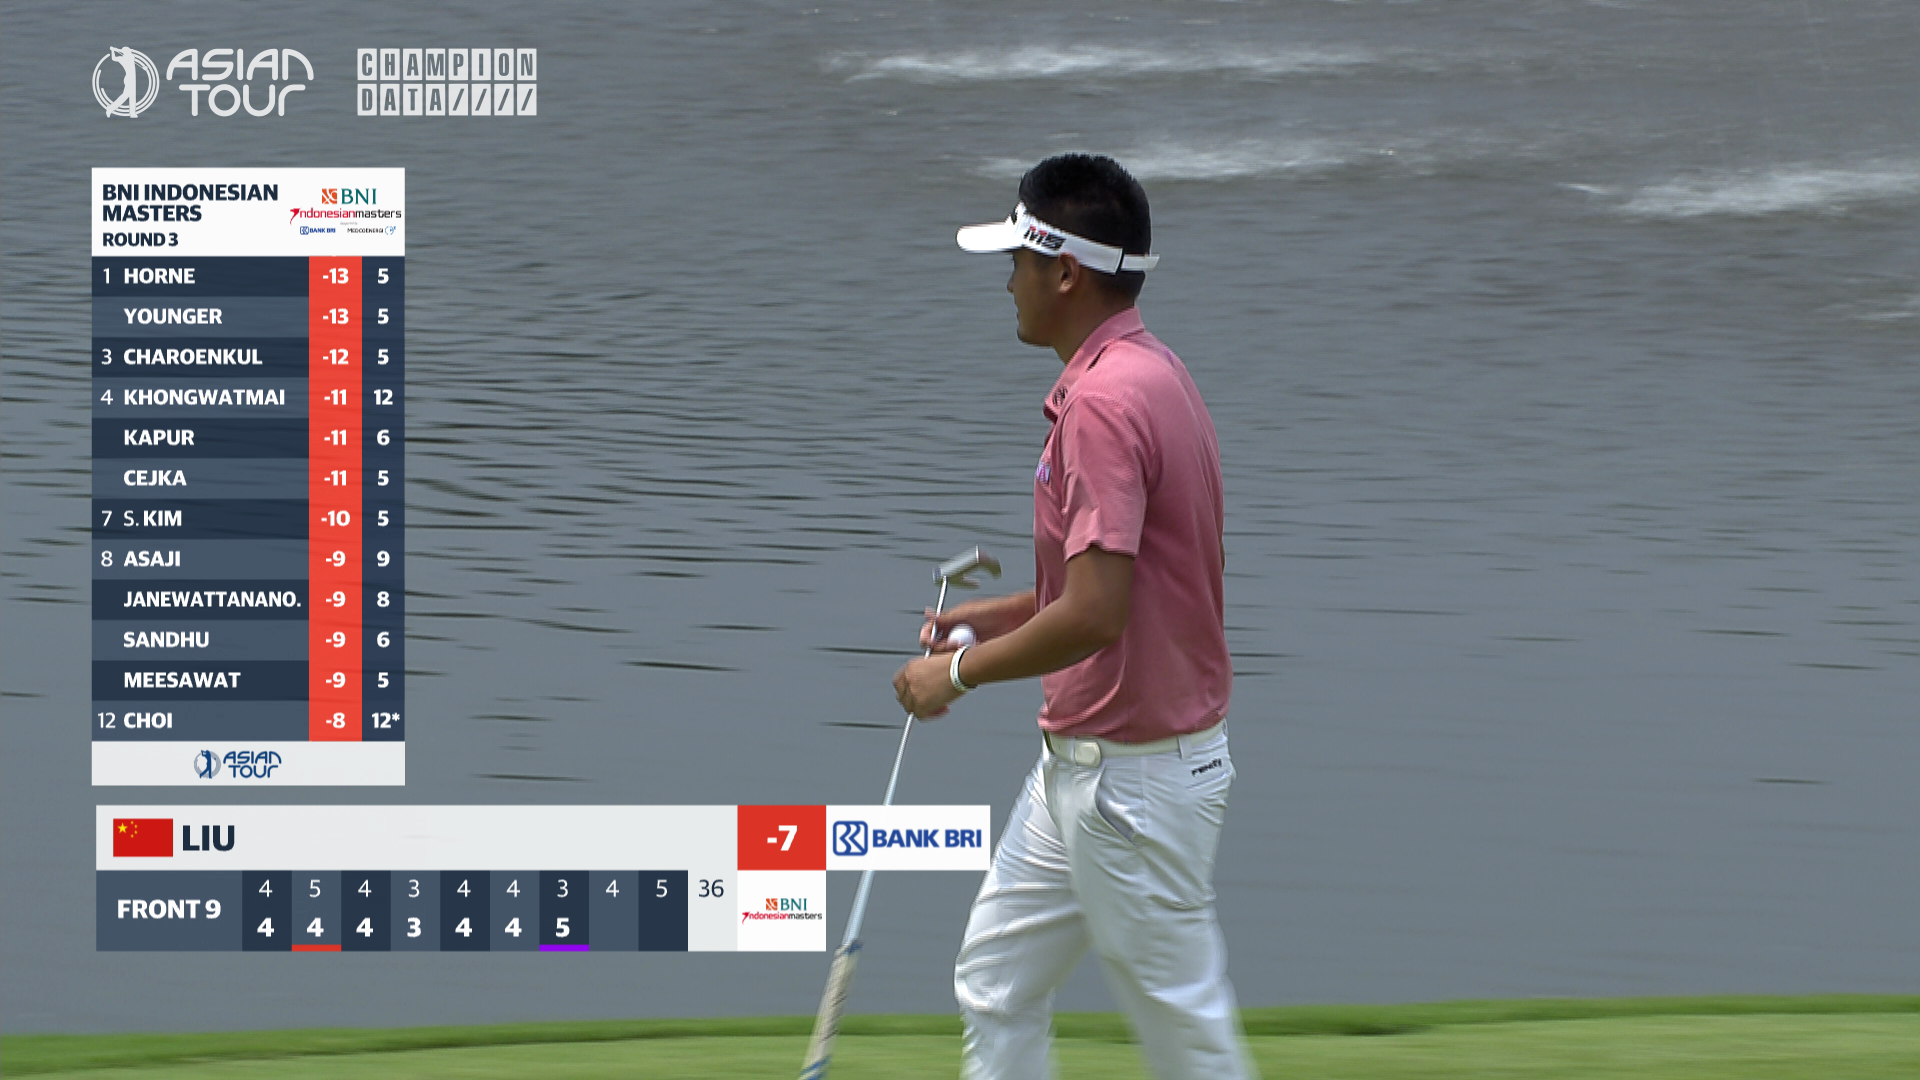
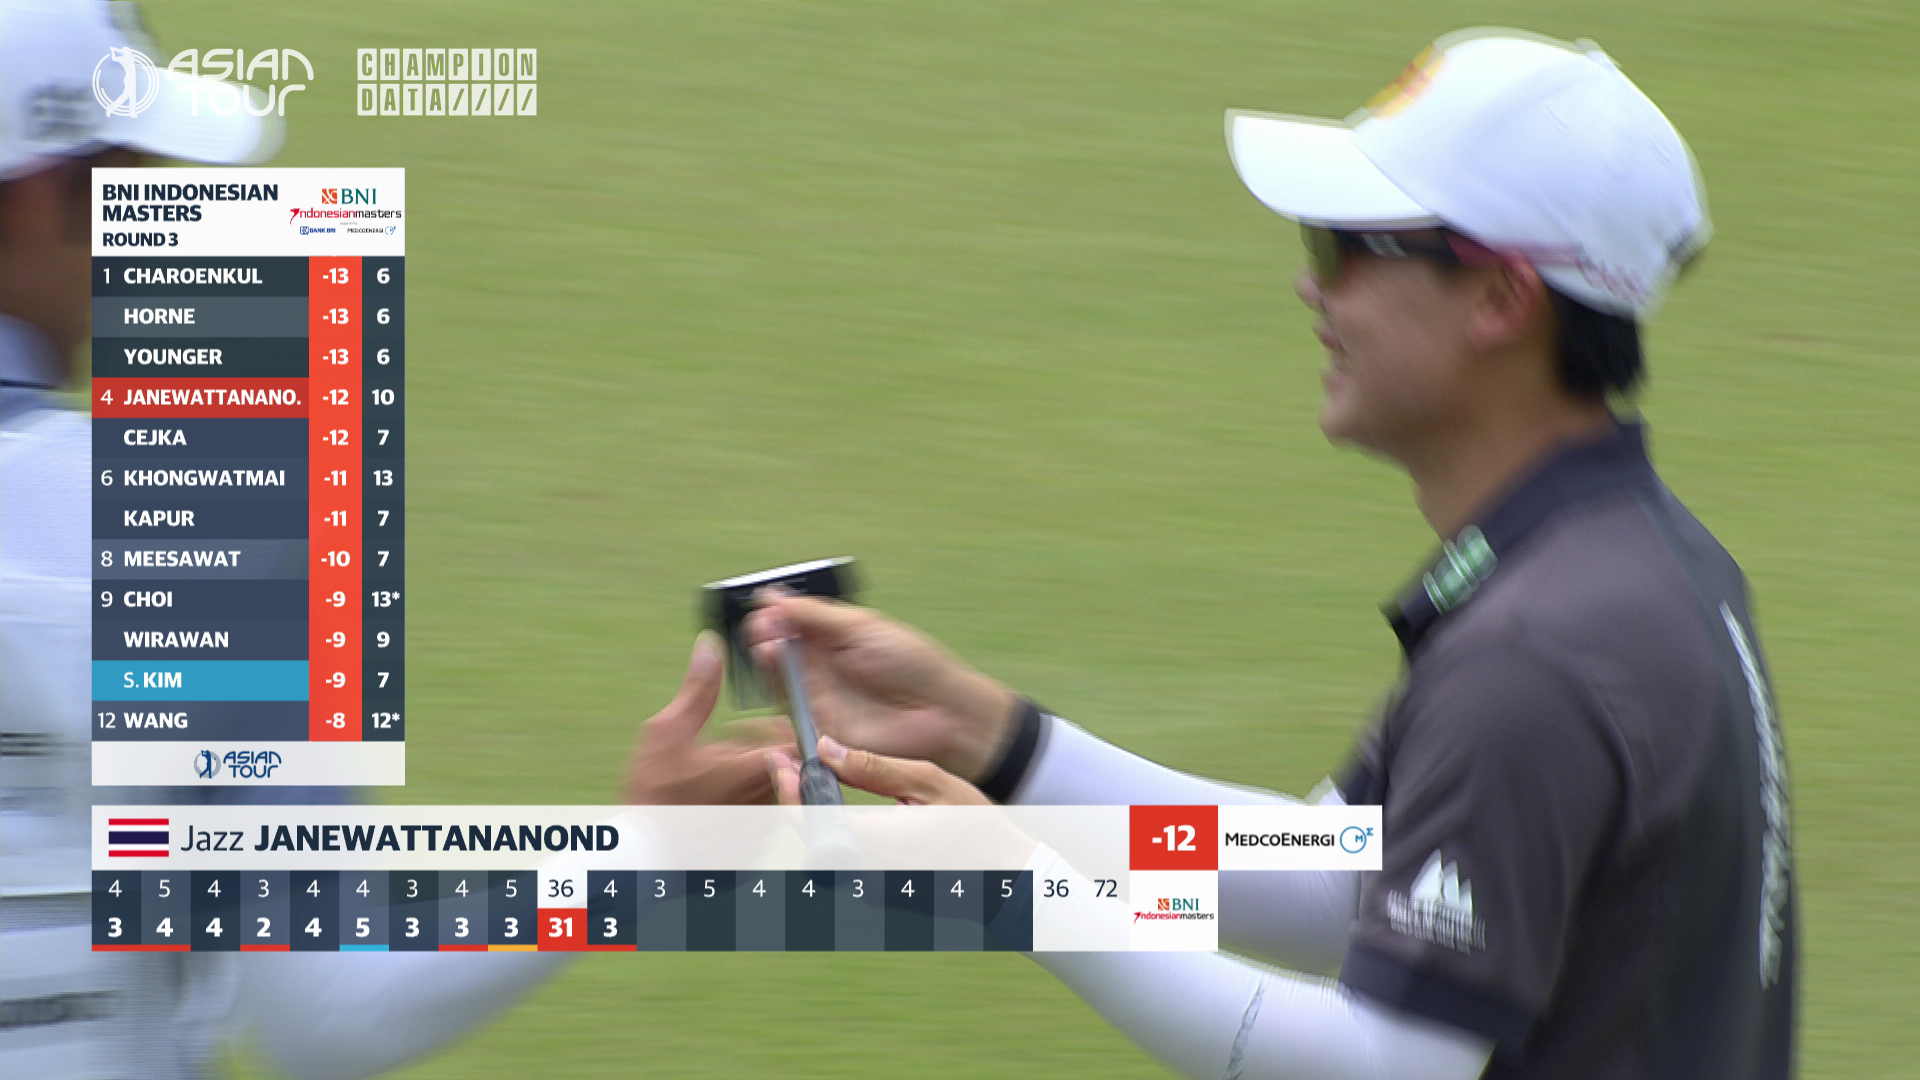
The Asian Tour producers also wanted to use Champion Data’s bank of knowledge and advanced statistics to help push more interesting storytelling across the different tournaments during the tour.
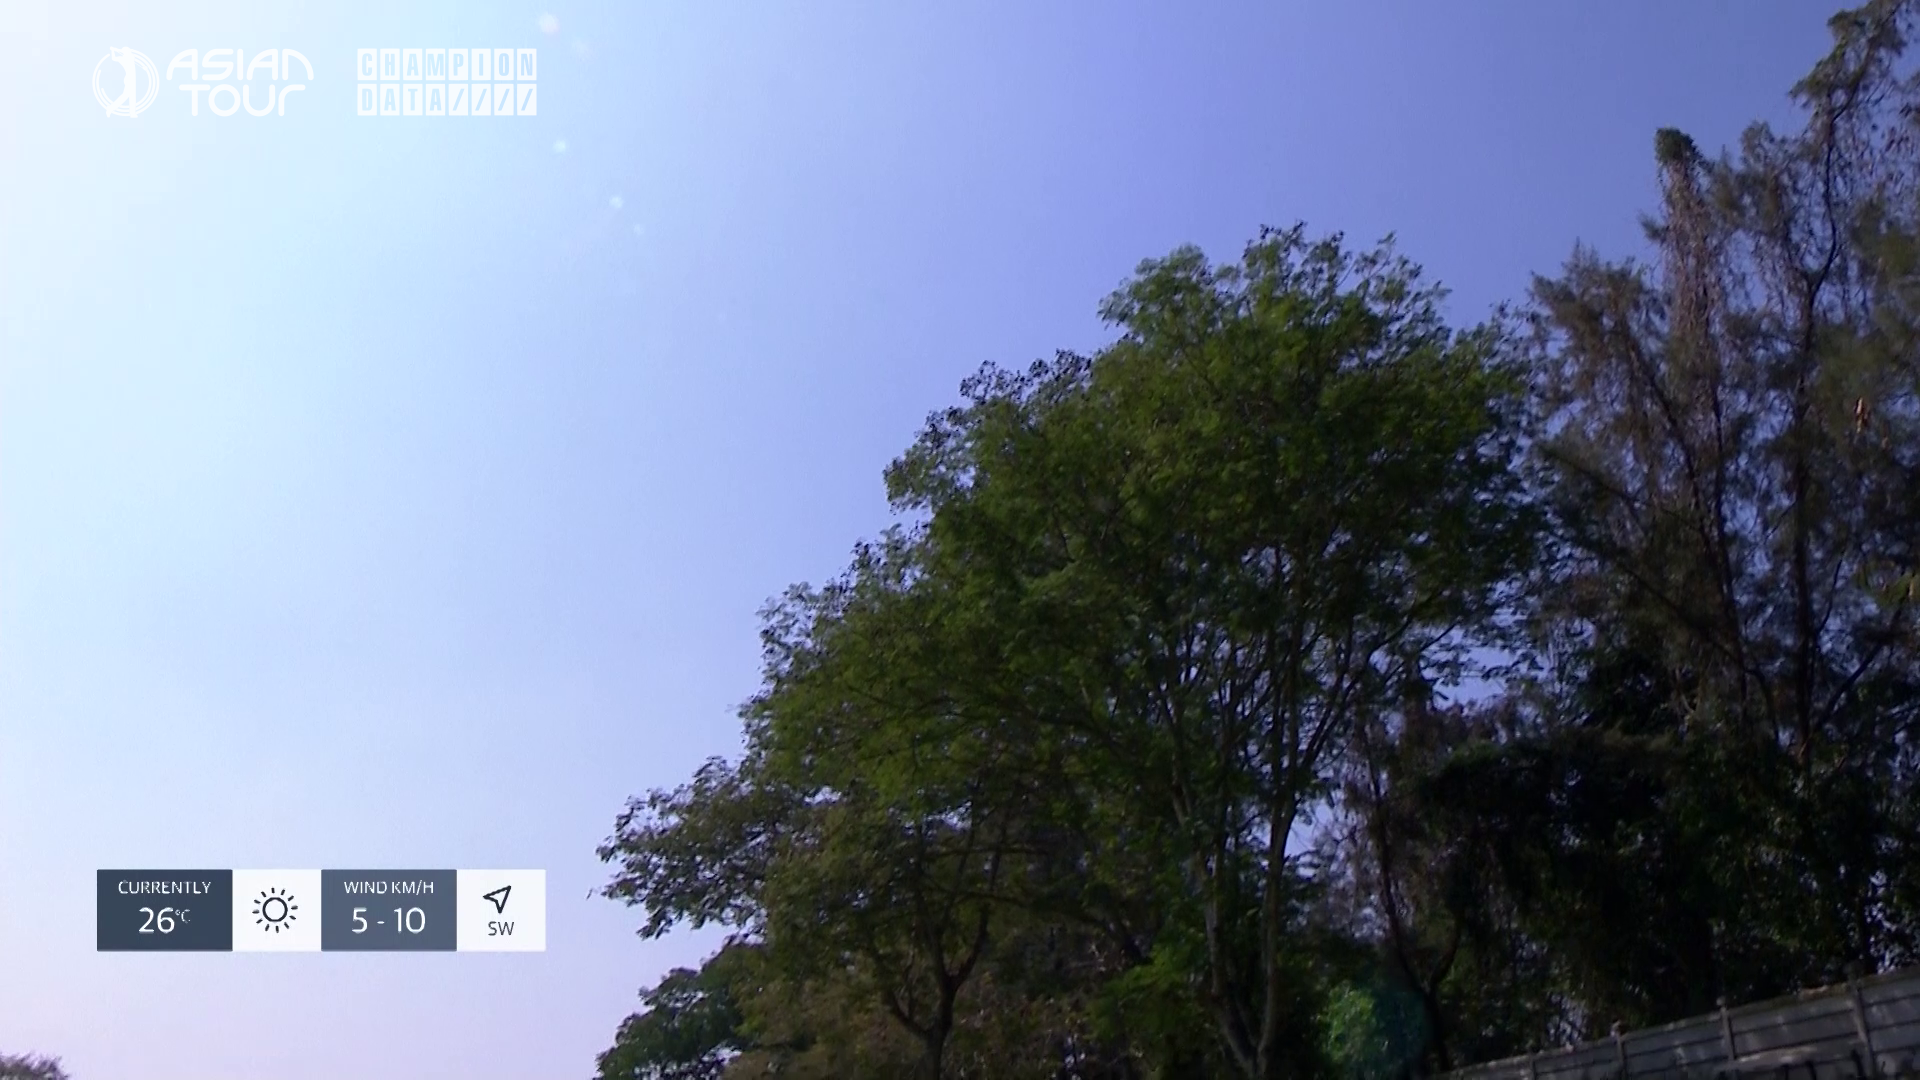
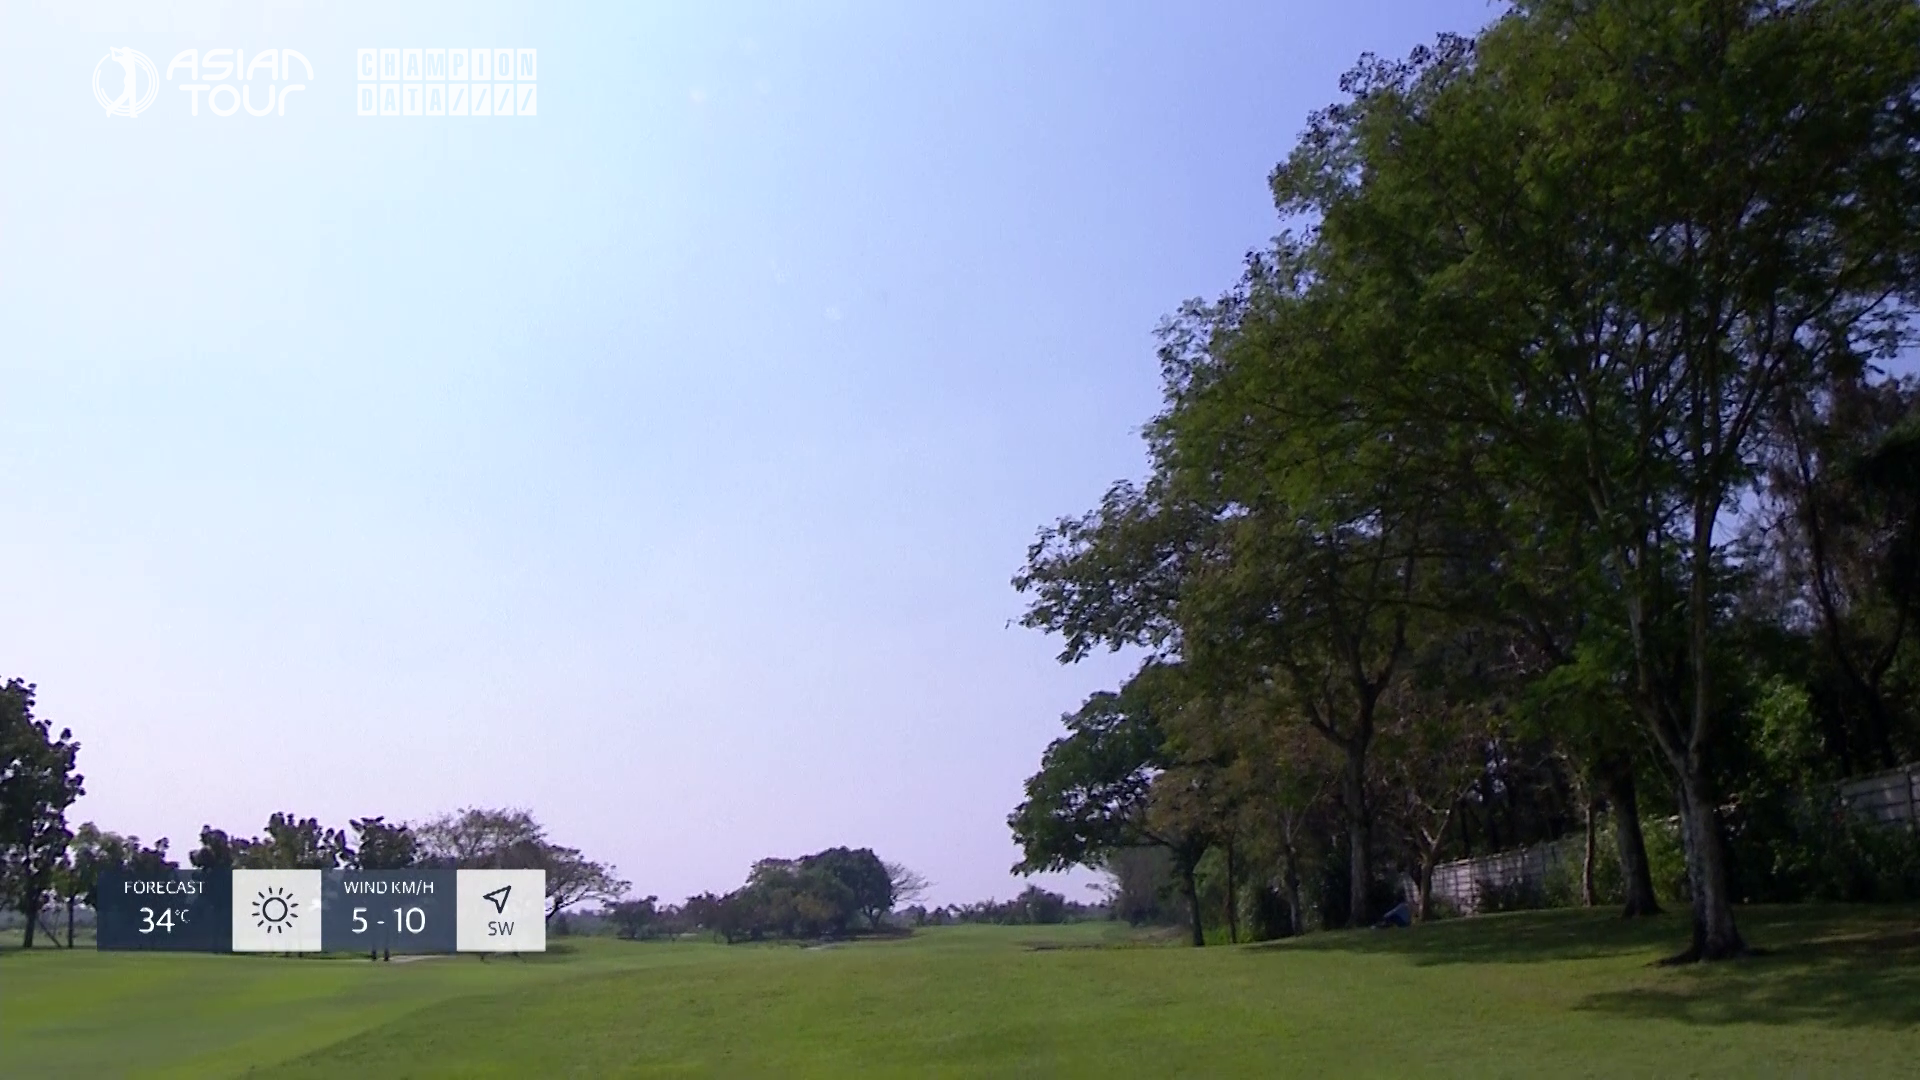
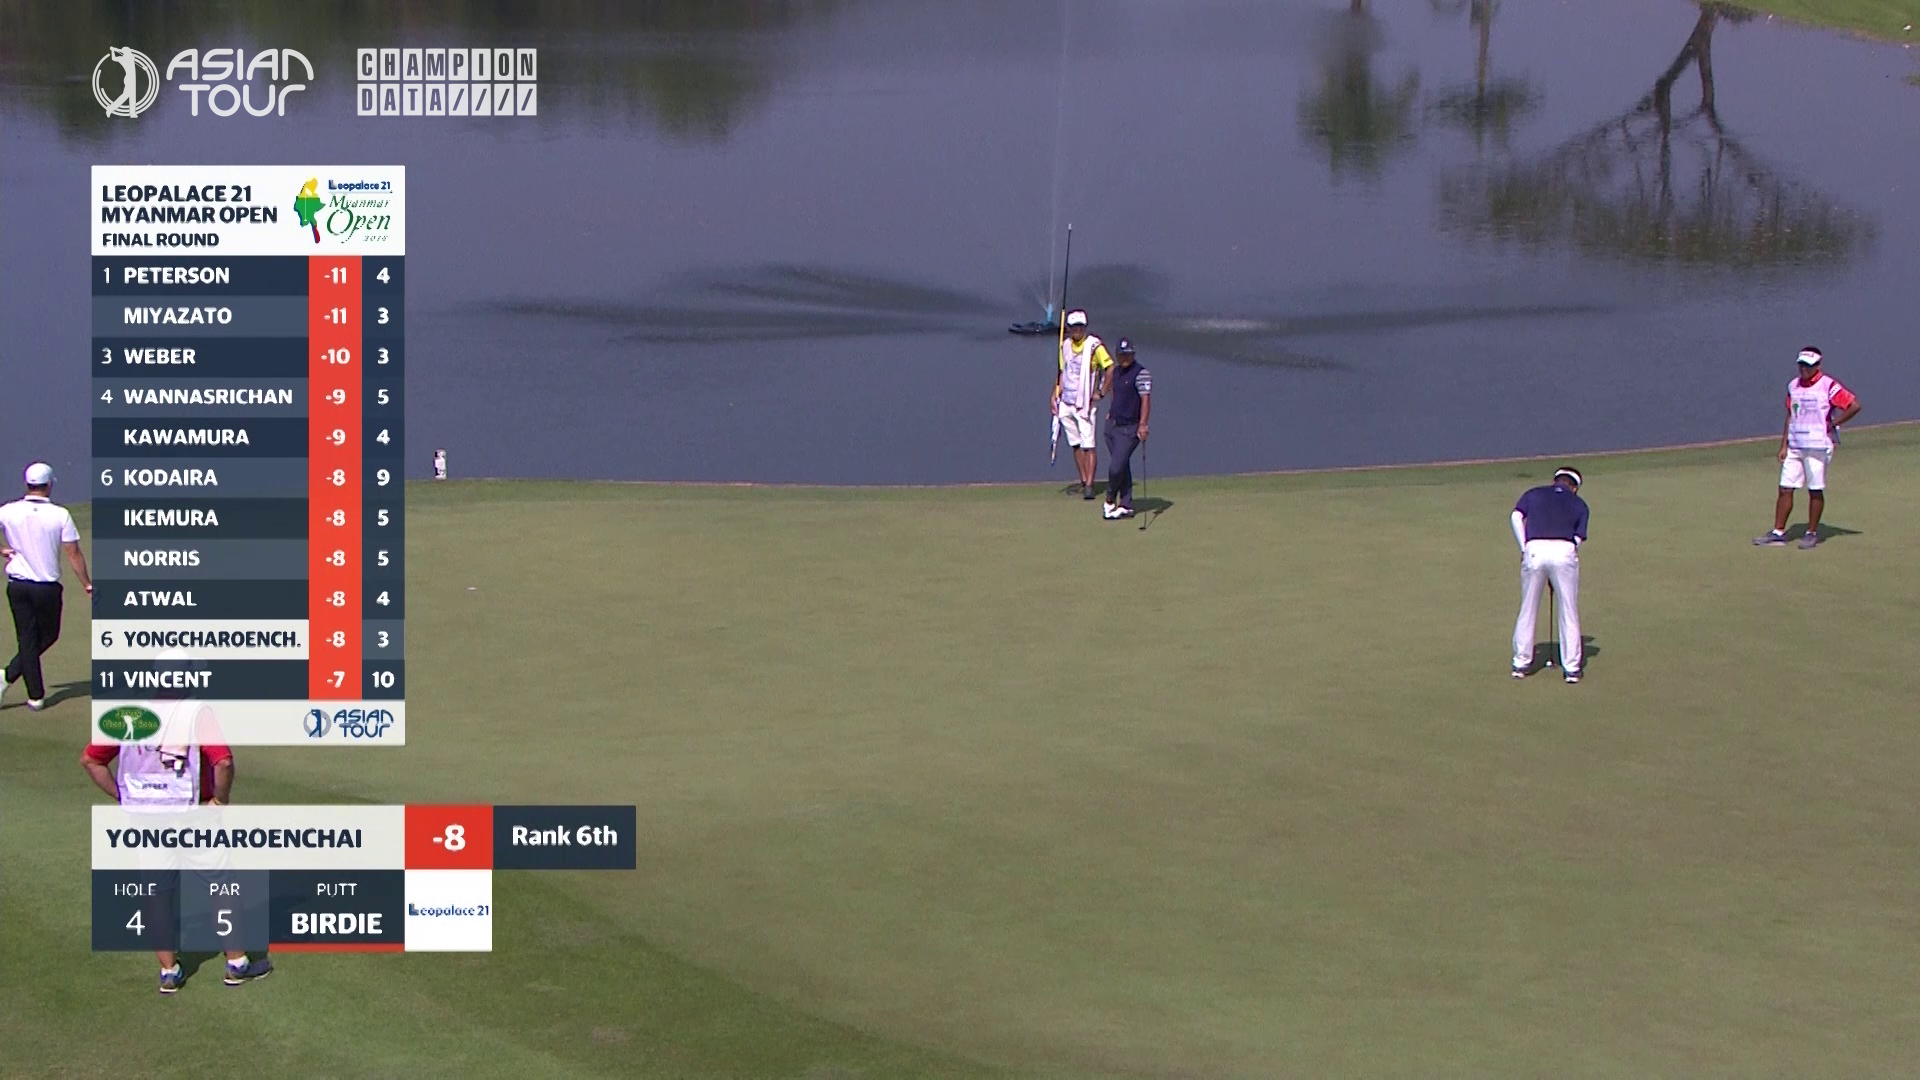
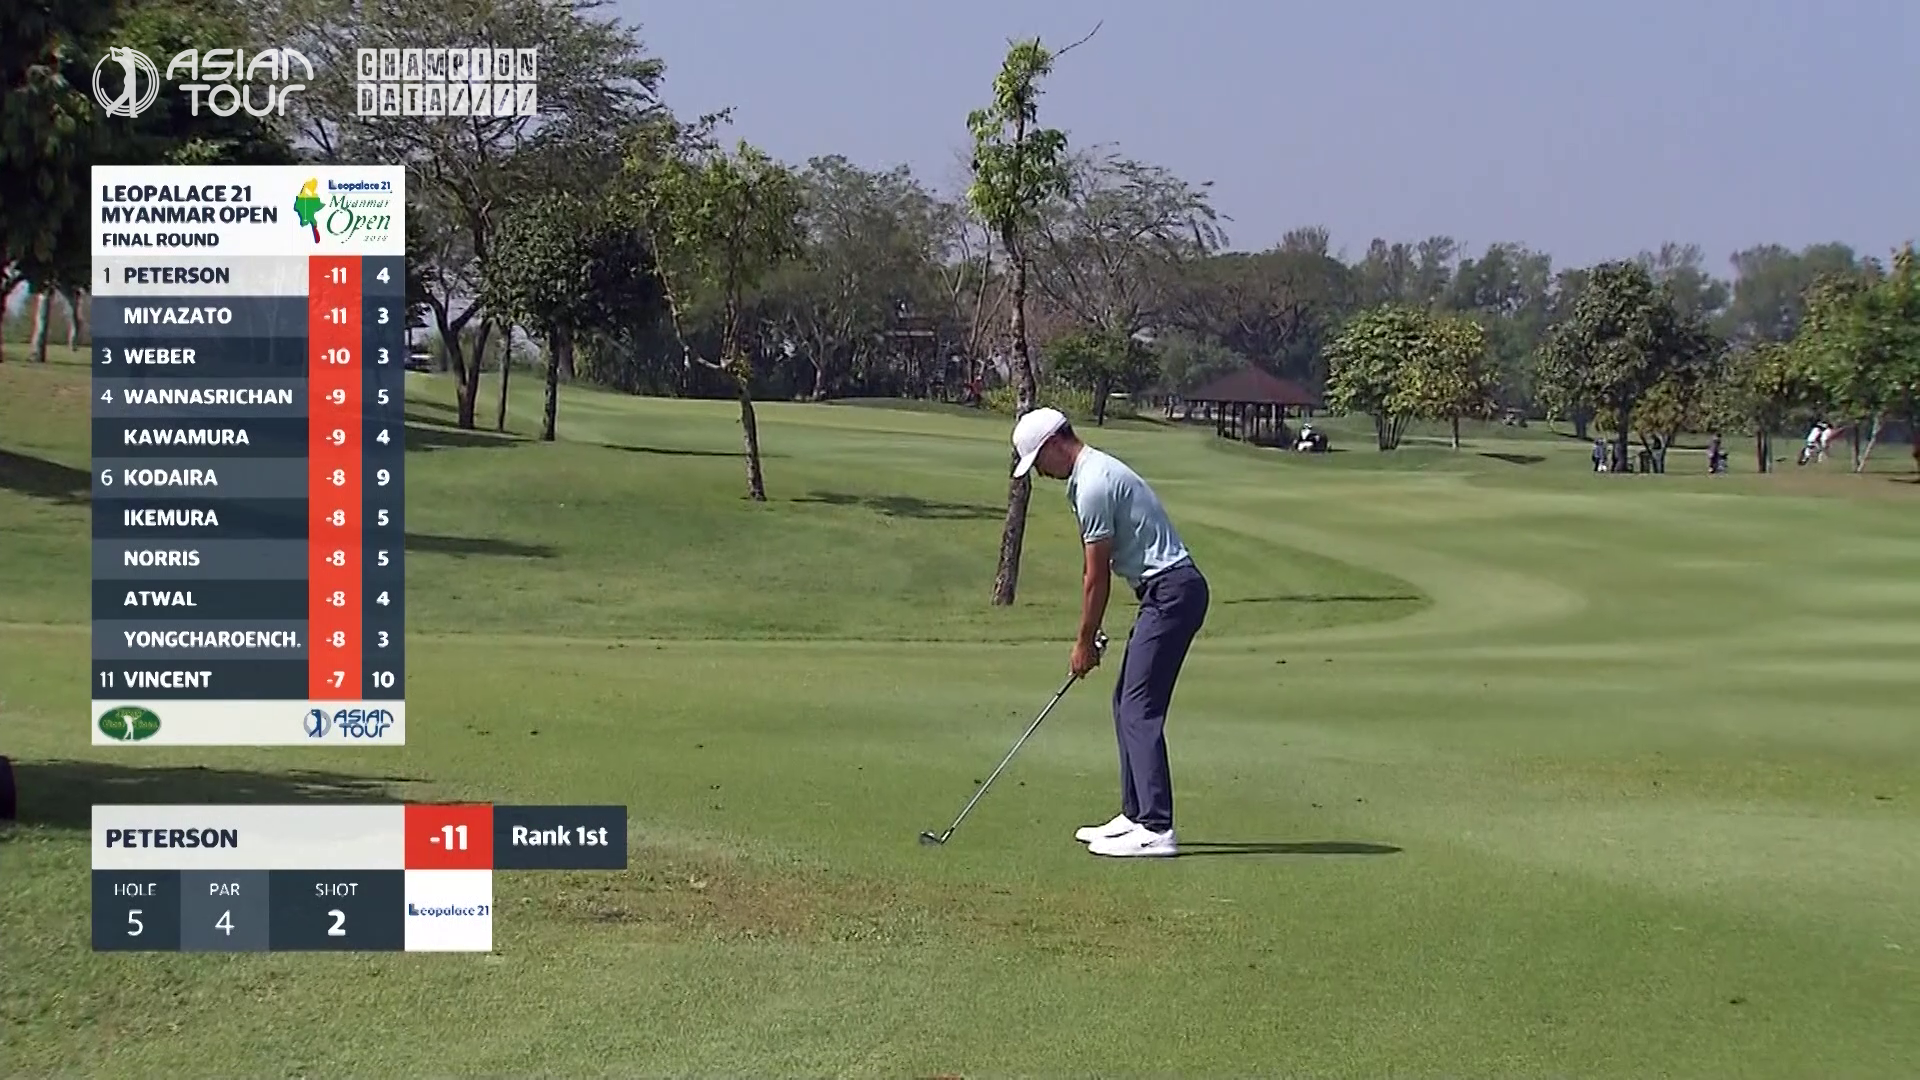
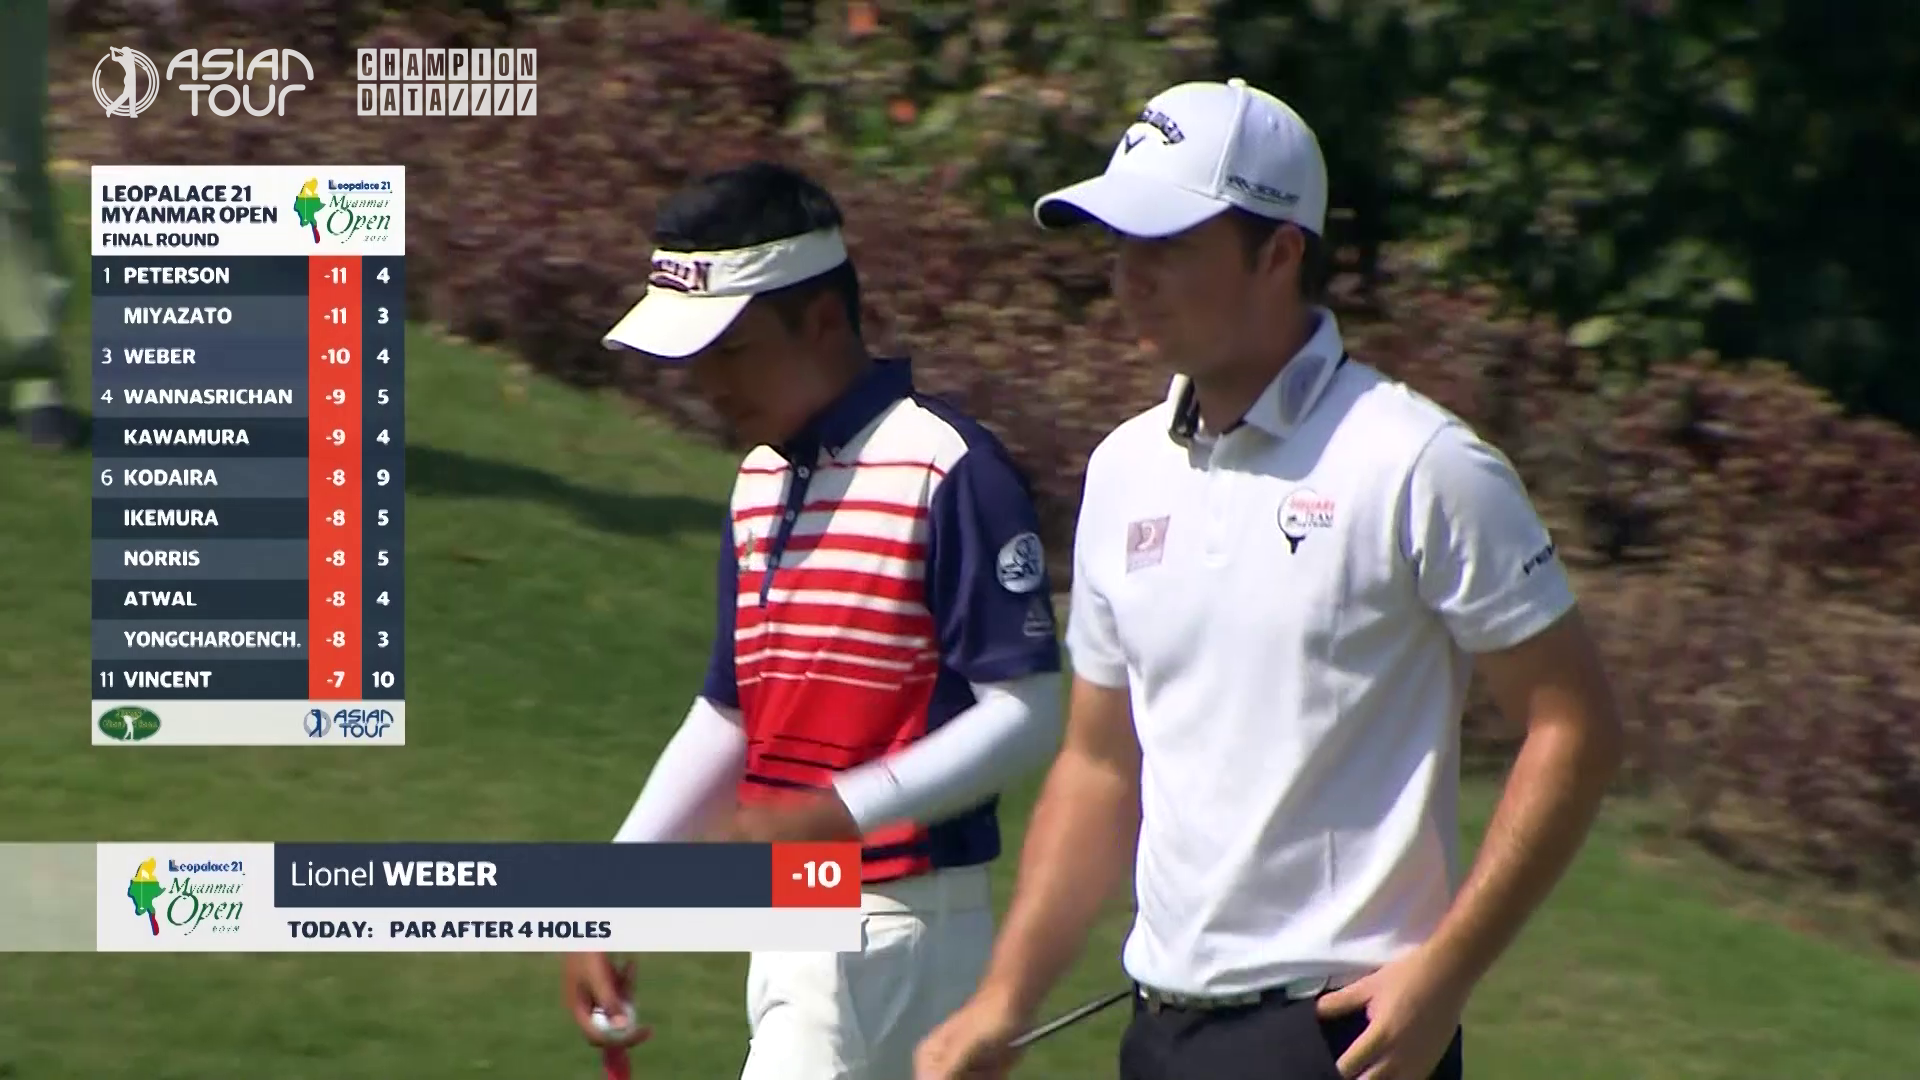
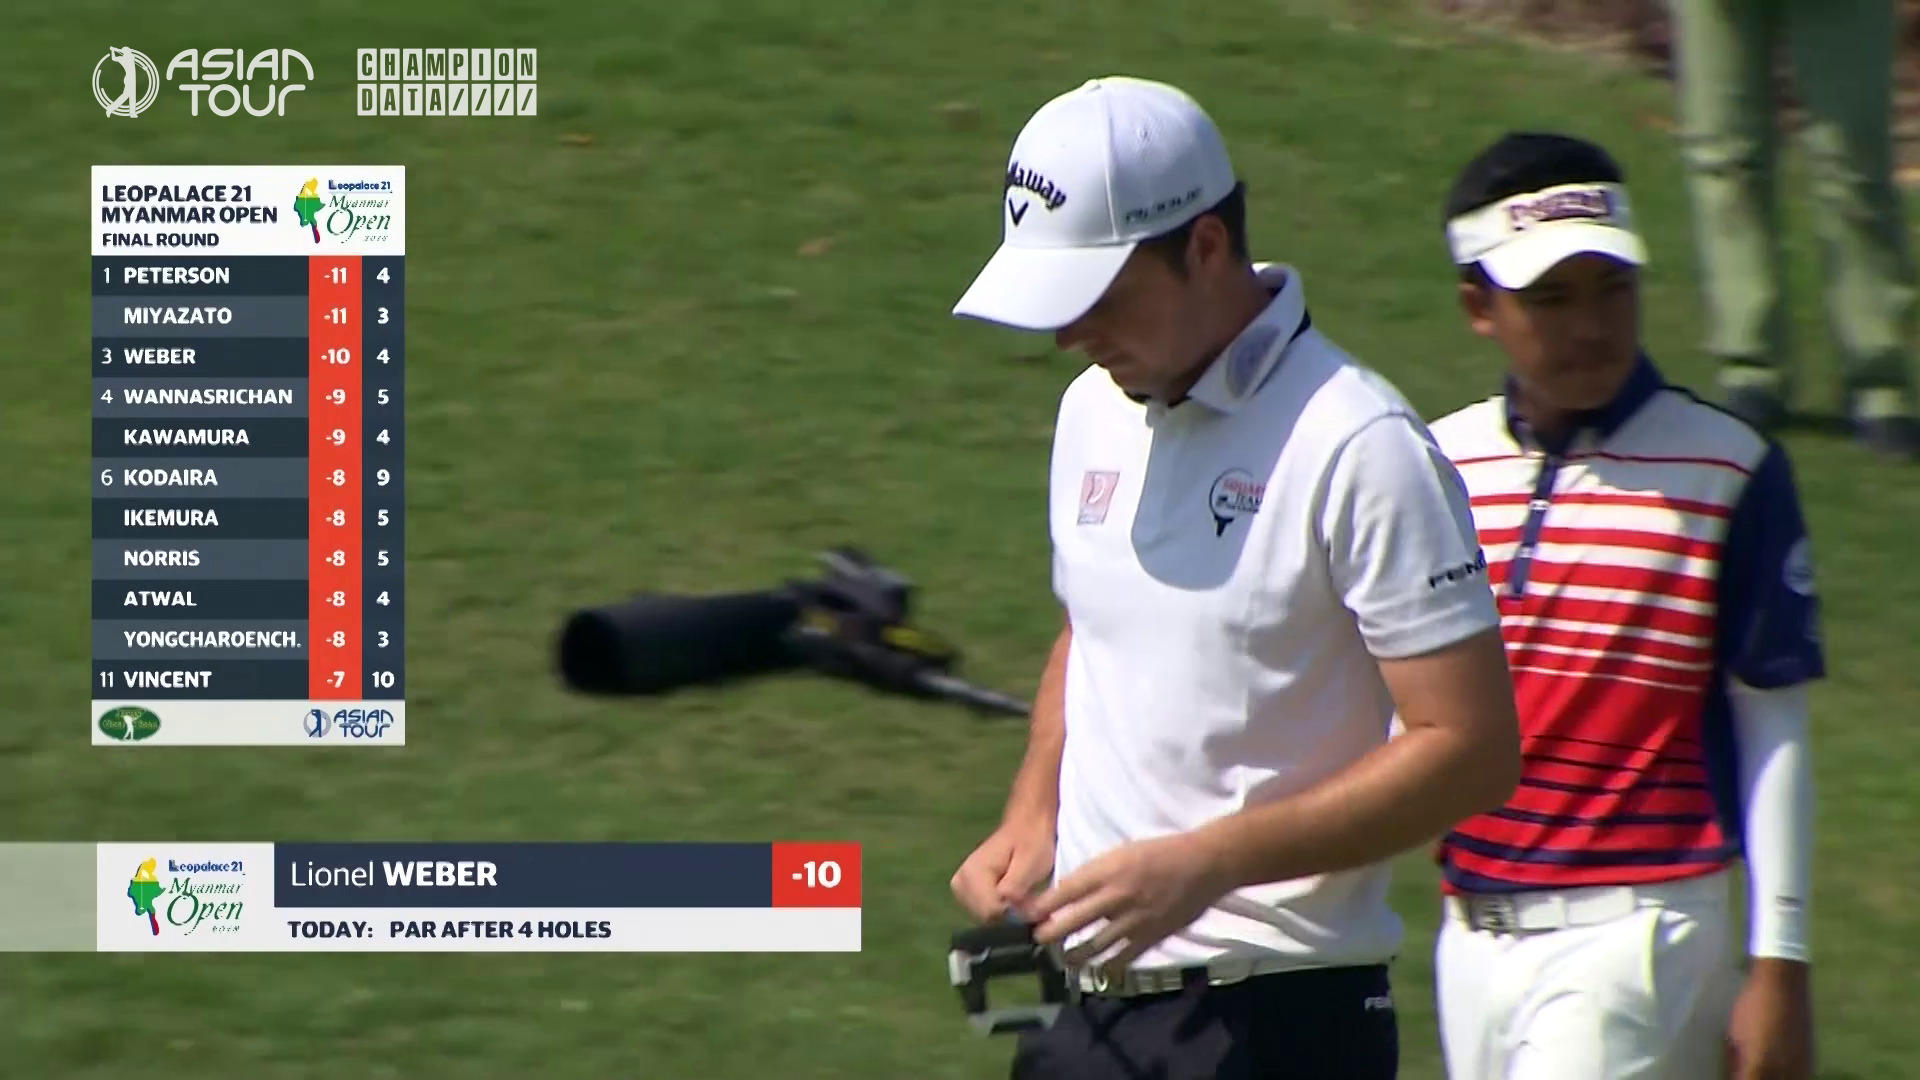
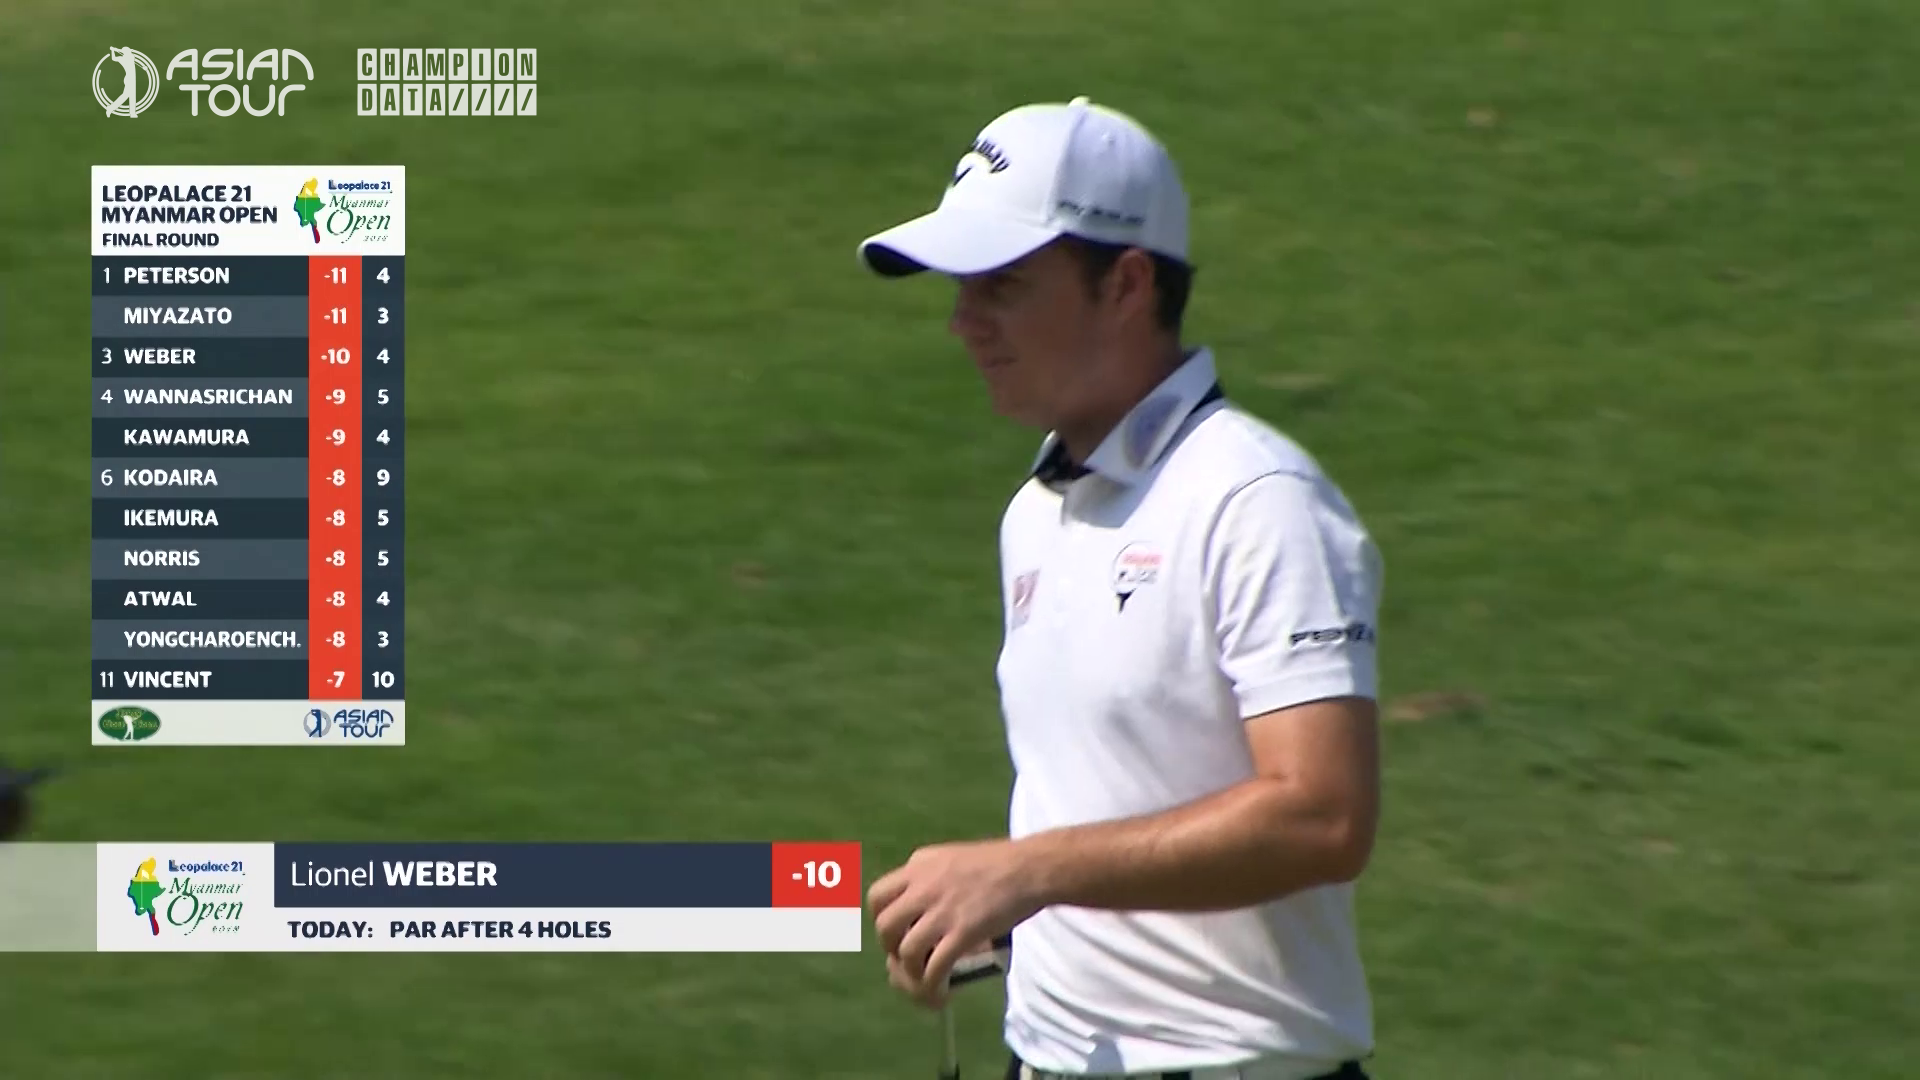
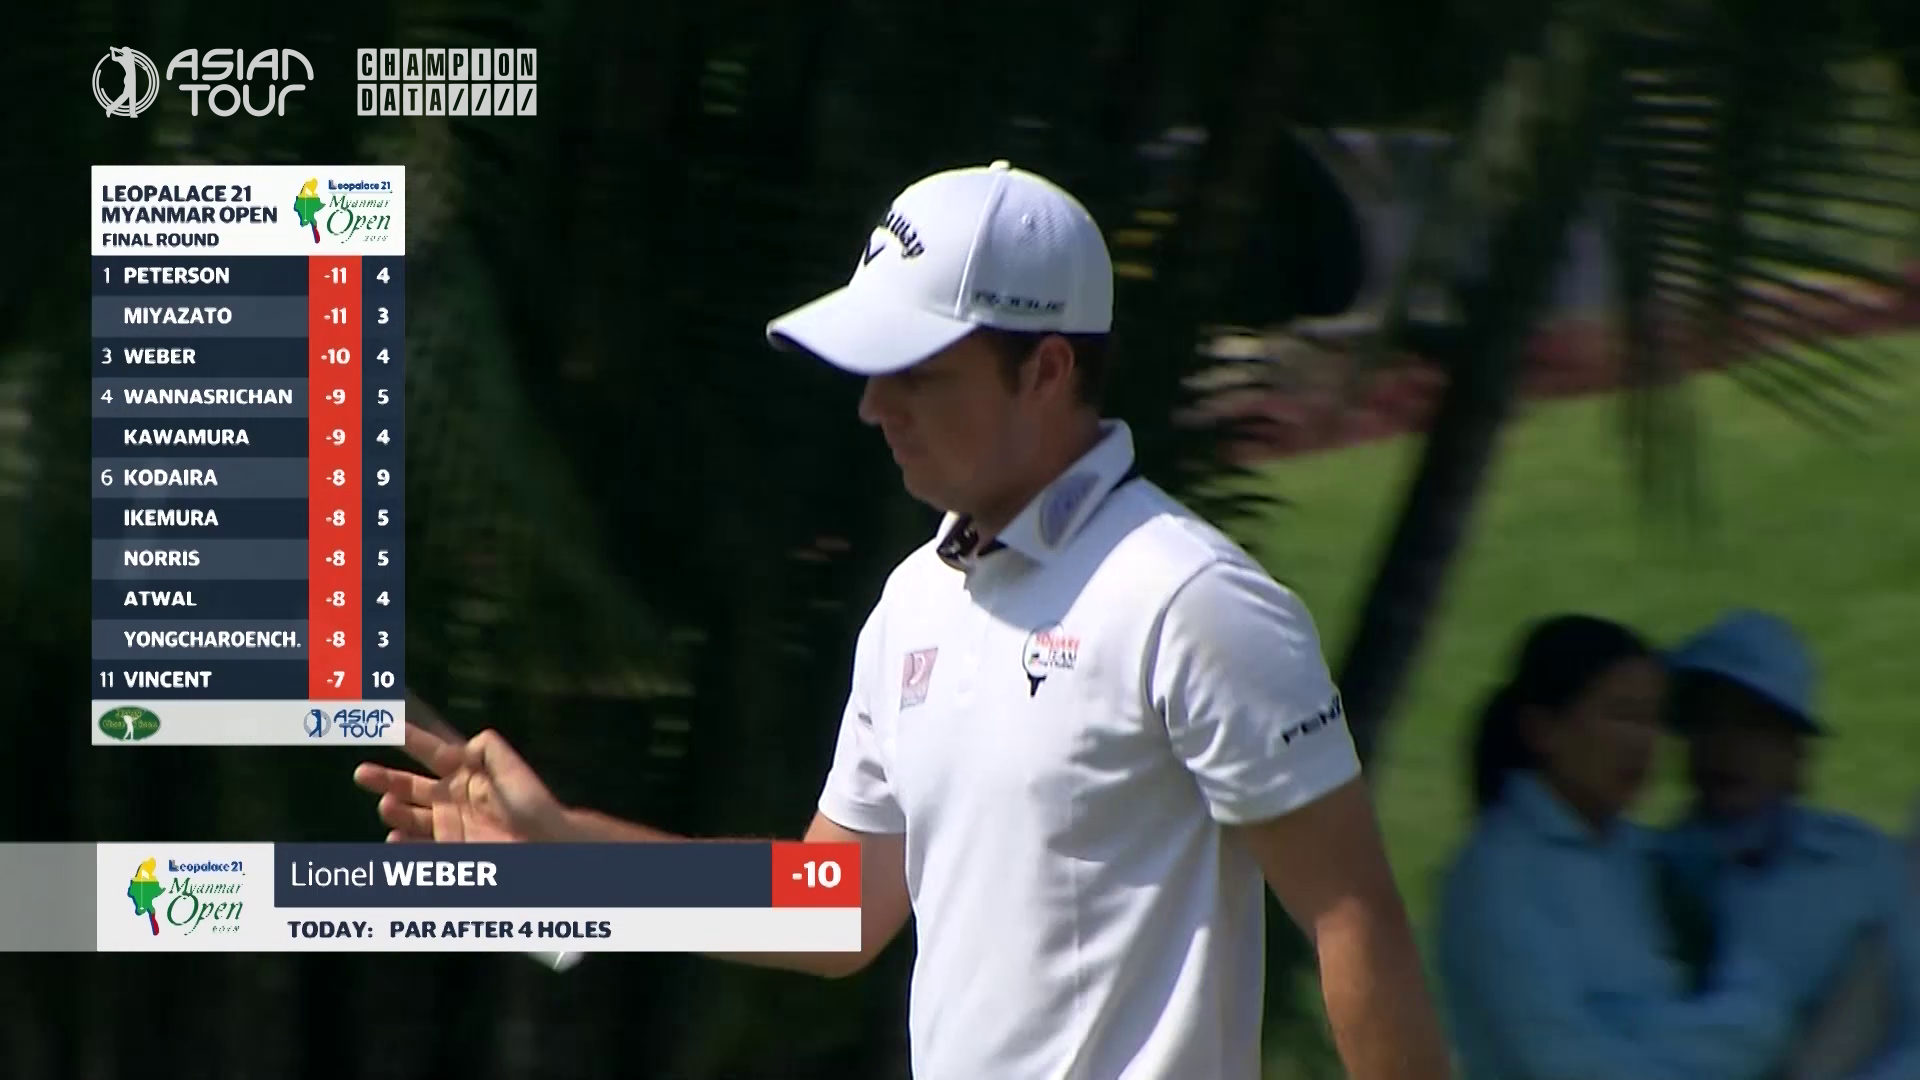
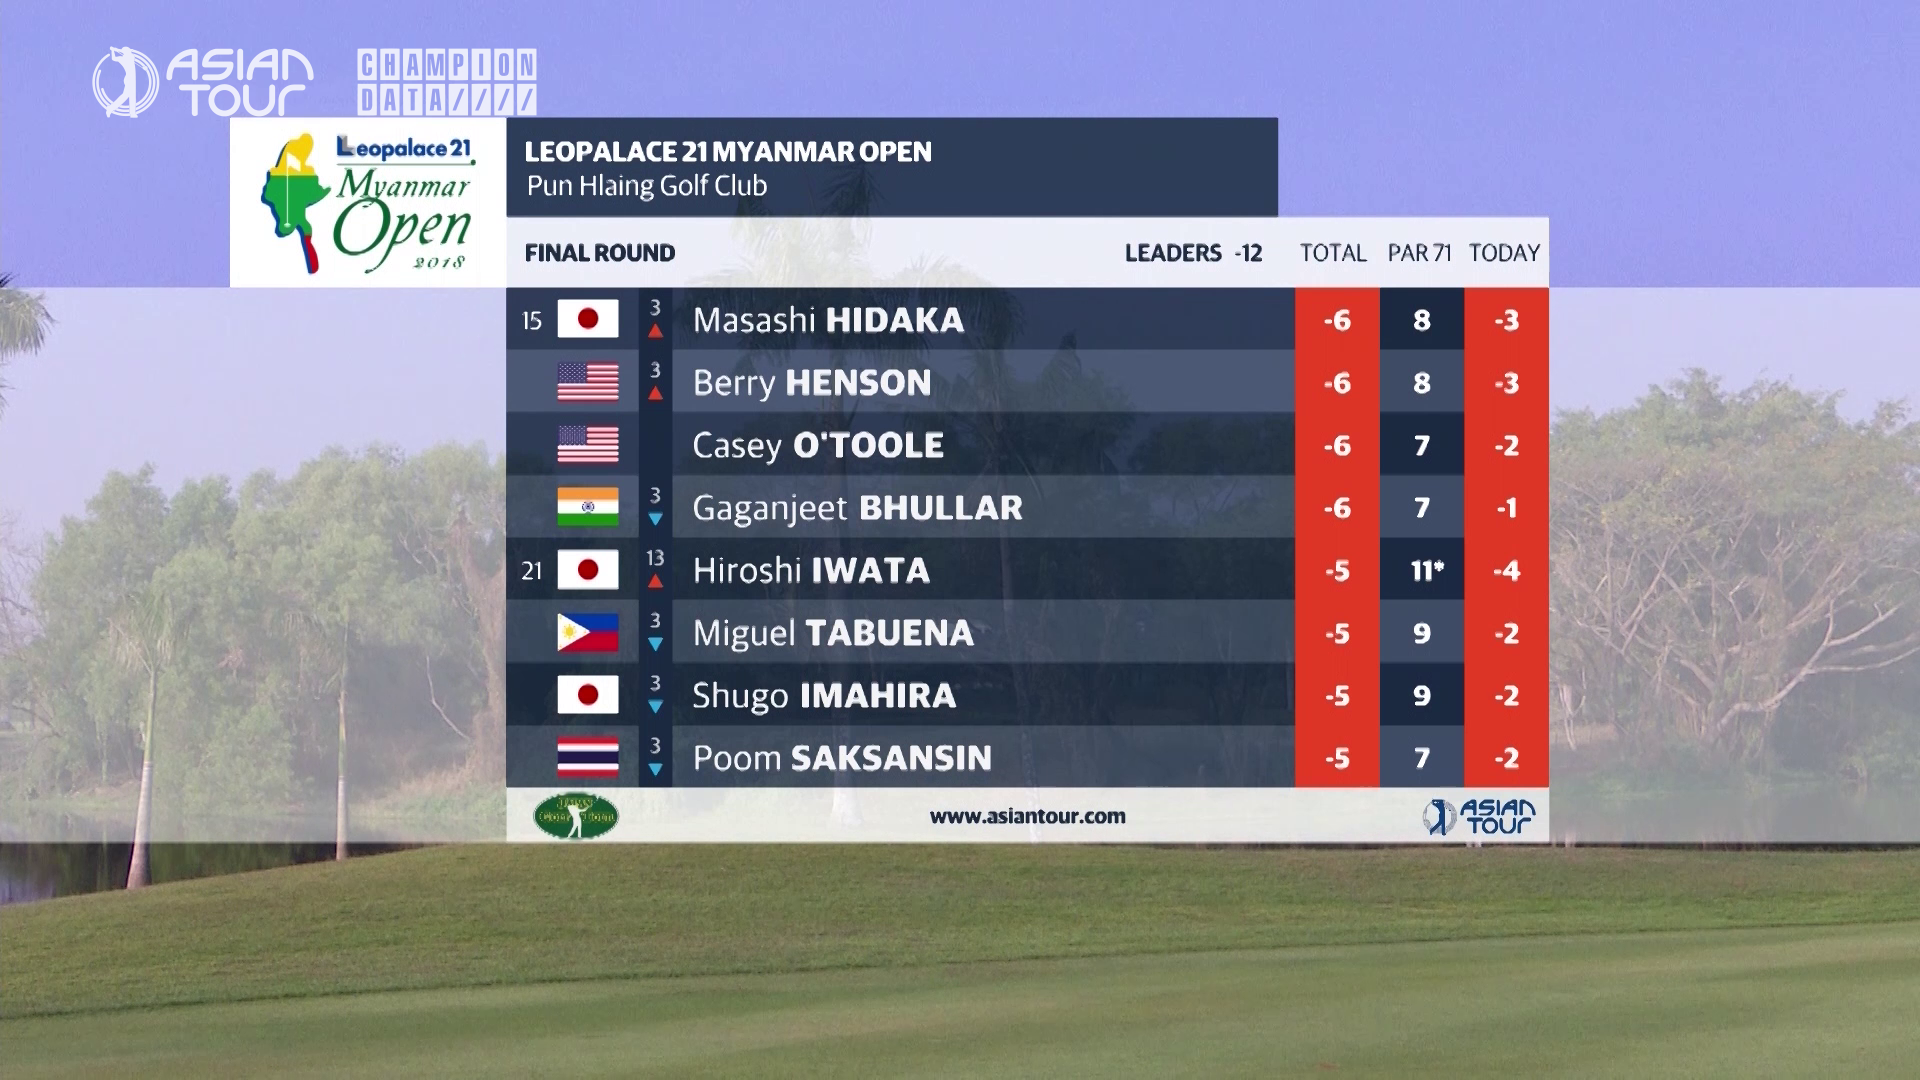
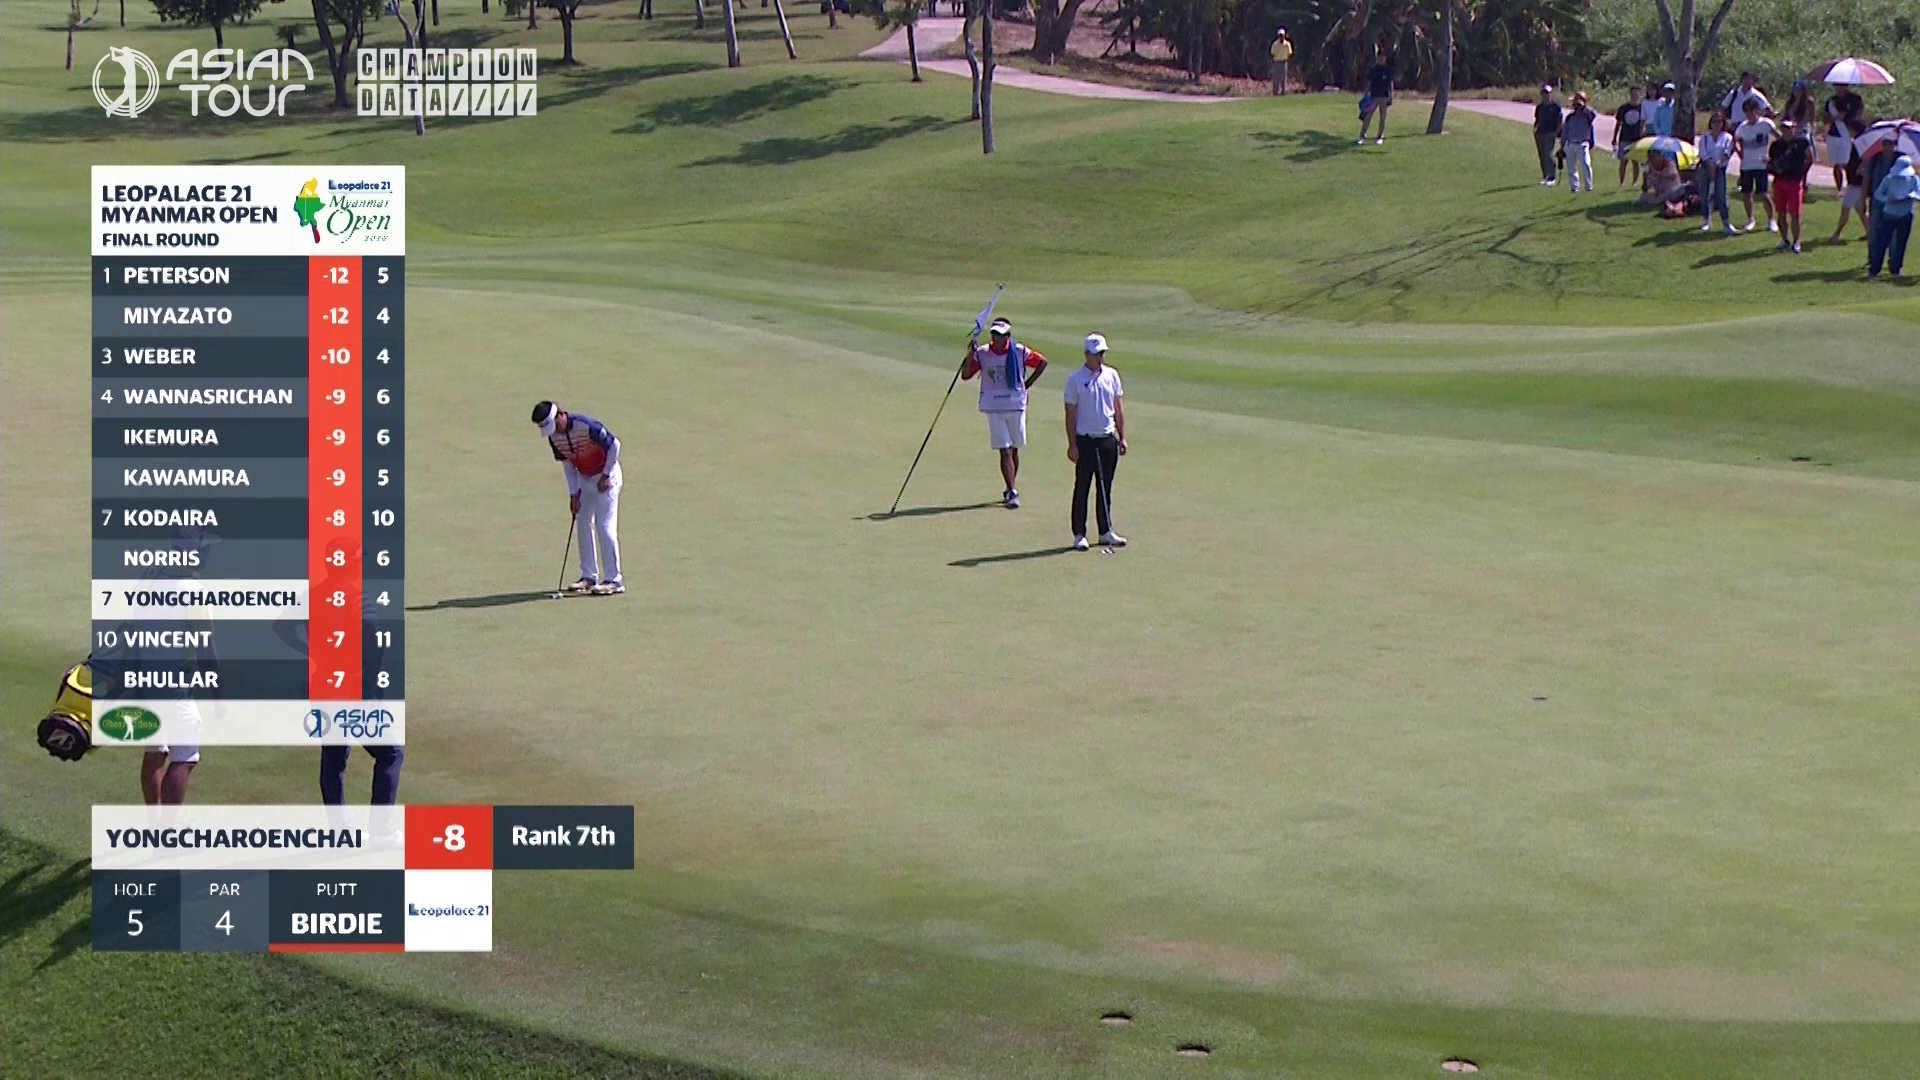
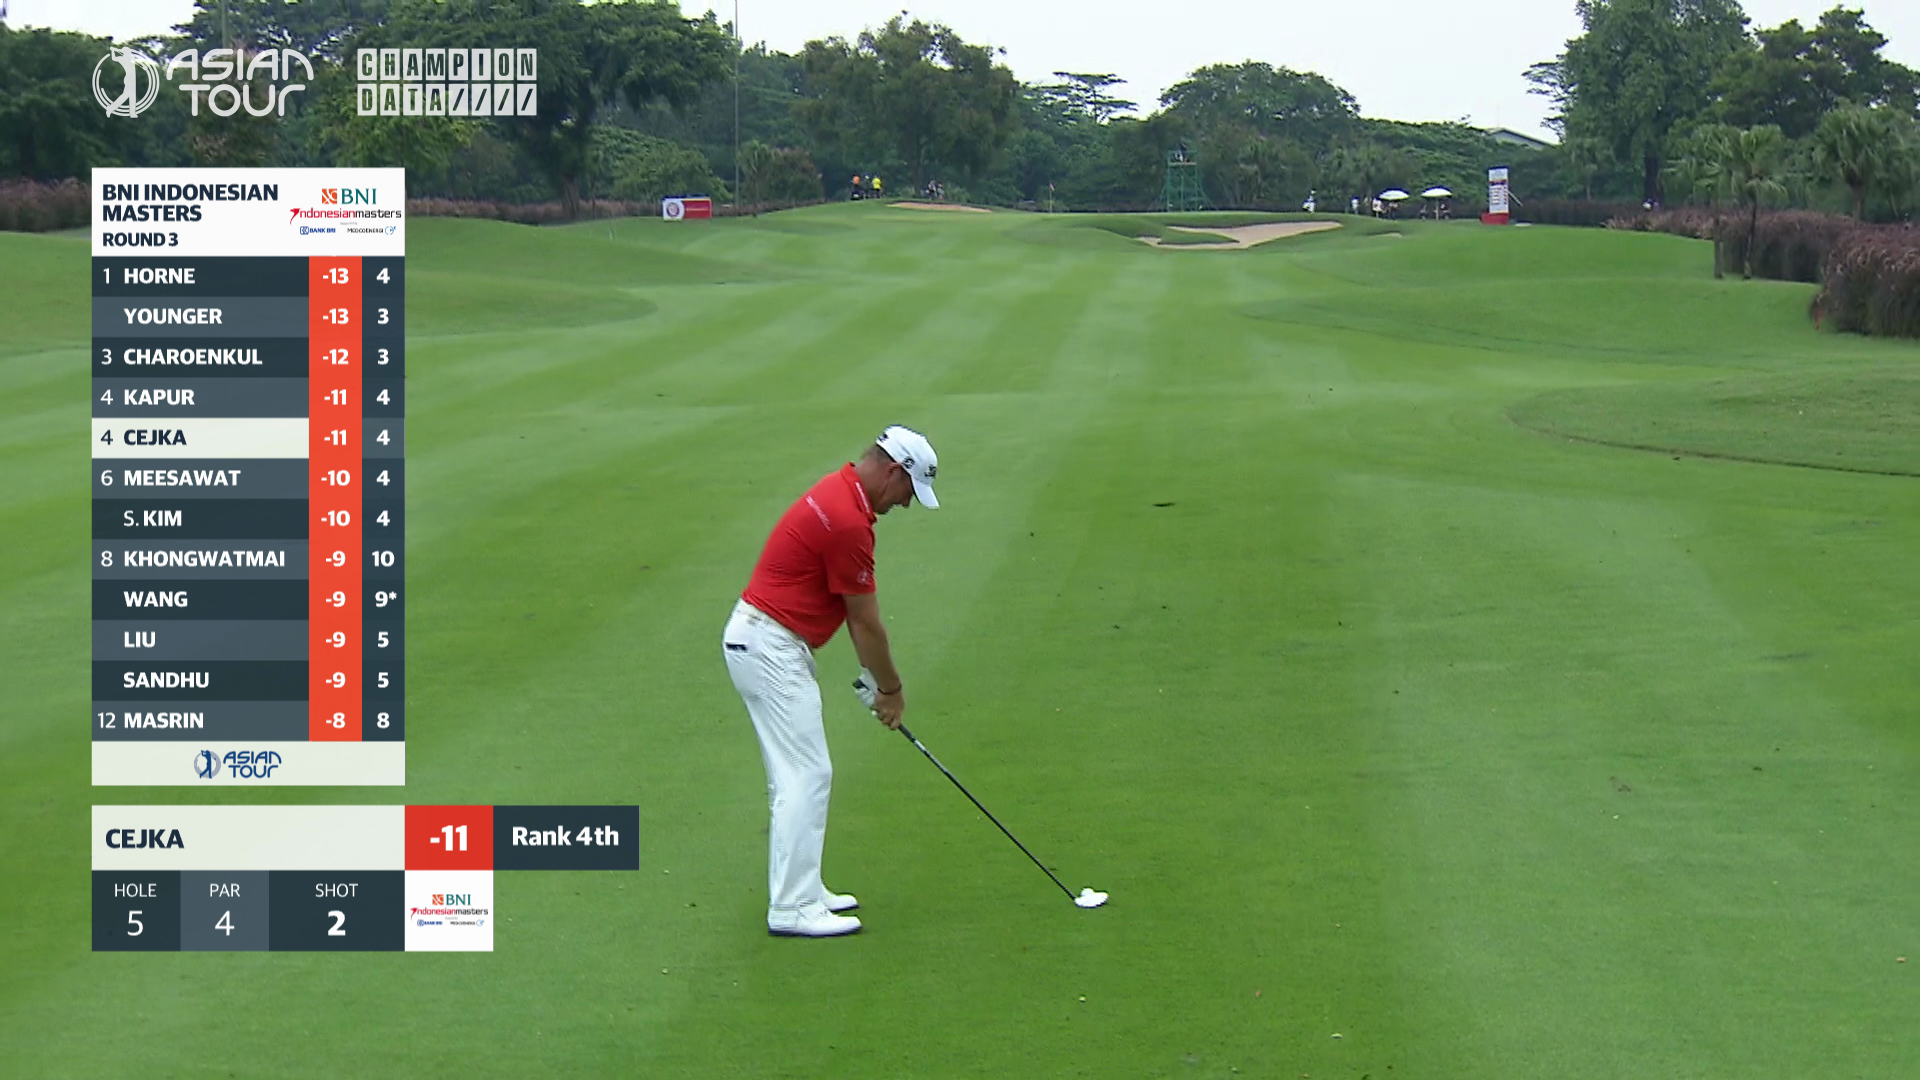
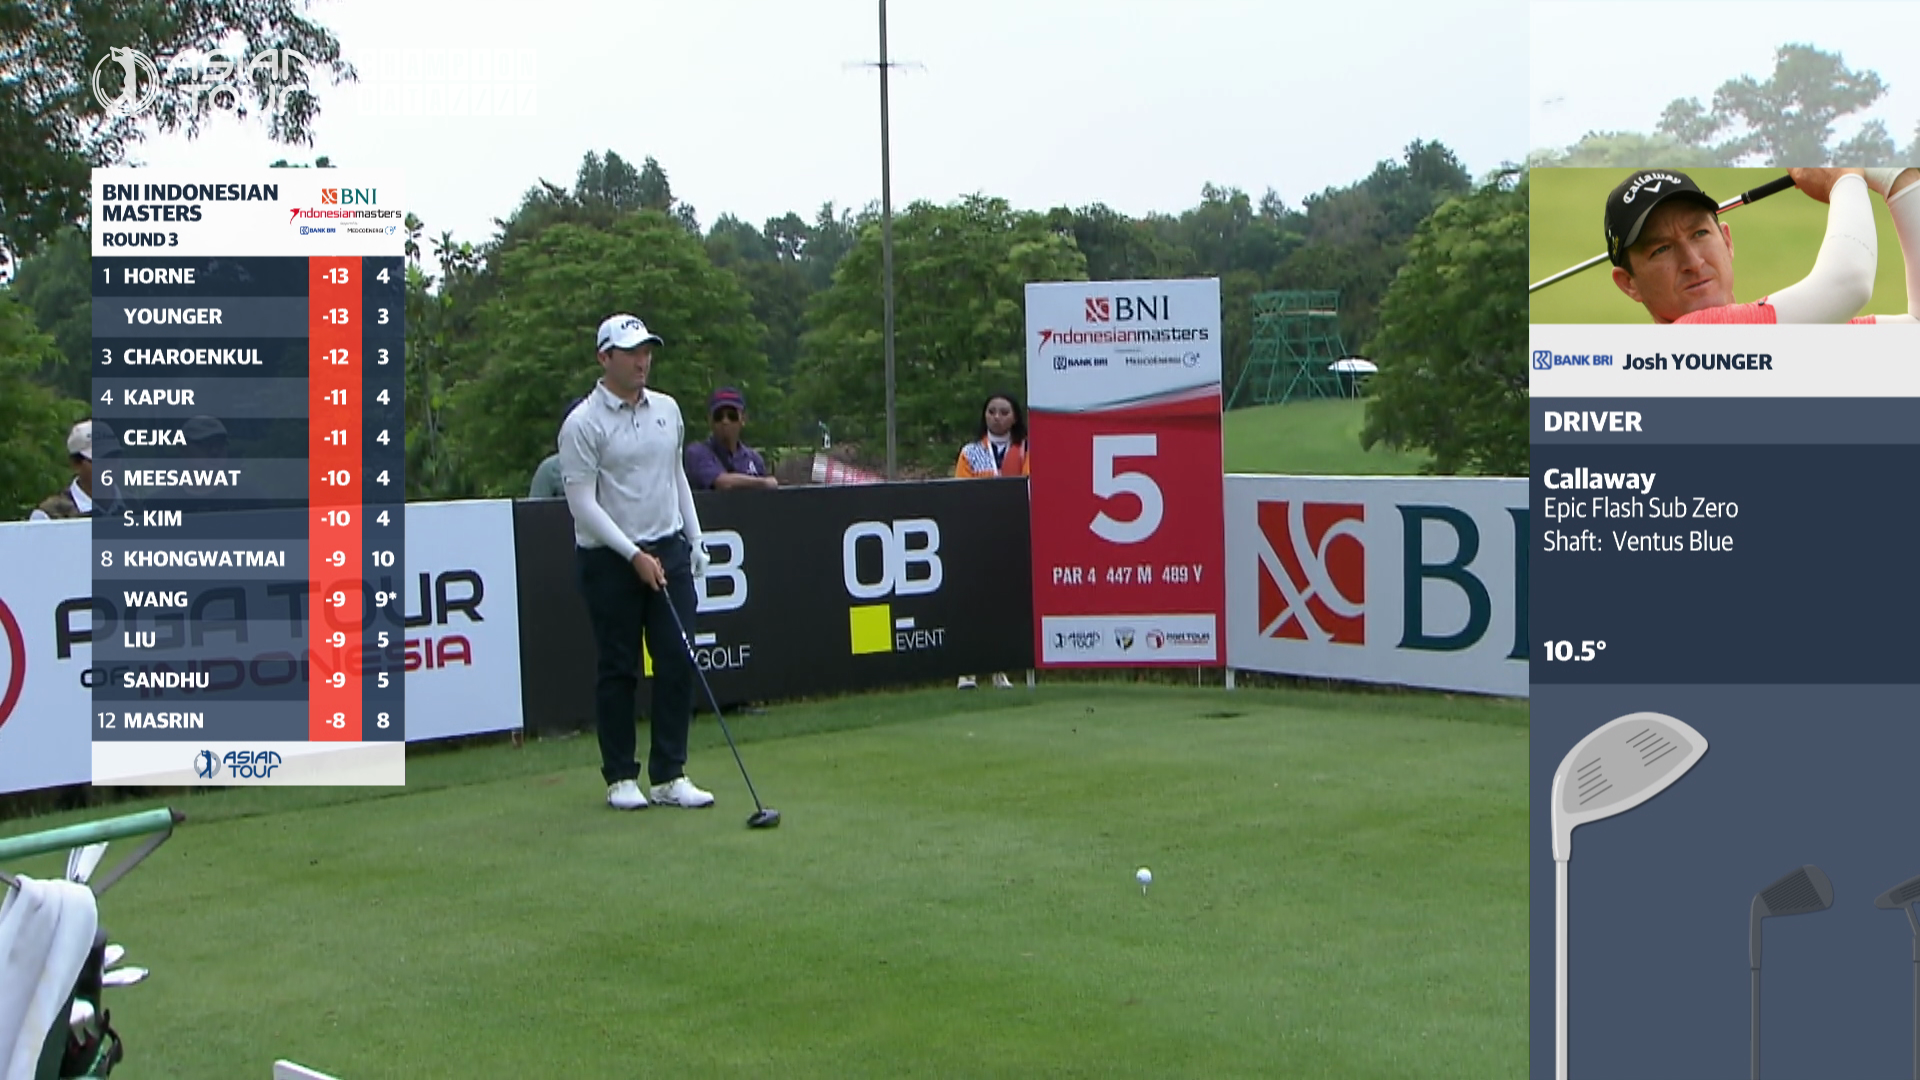
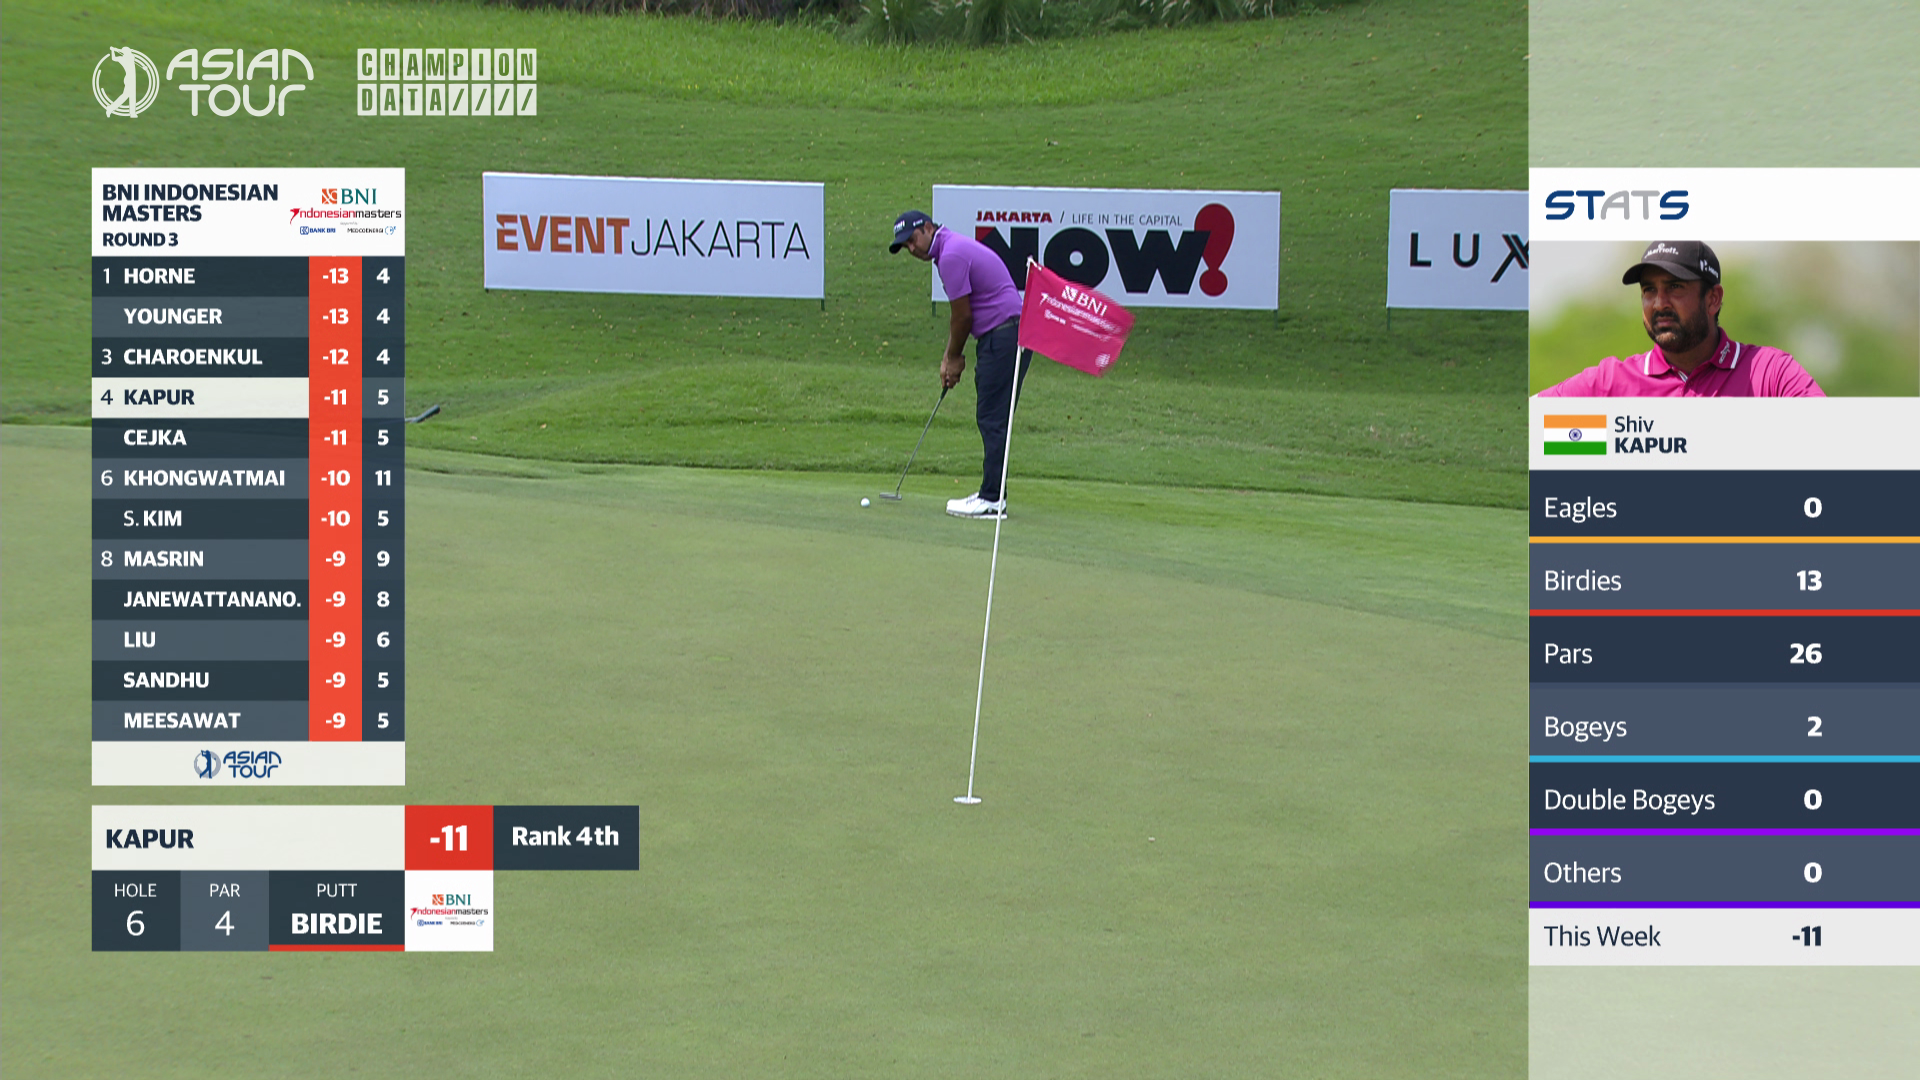
Jarred took the design lead role and created a graphics package that was visually unique, using strong colour variations and levels of transparency to help embed the graphics into the on-screen content.
I took his vision and built the graphics in Vizrt Artist, extending his graphics to the multiple score and statistics variations needed.
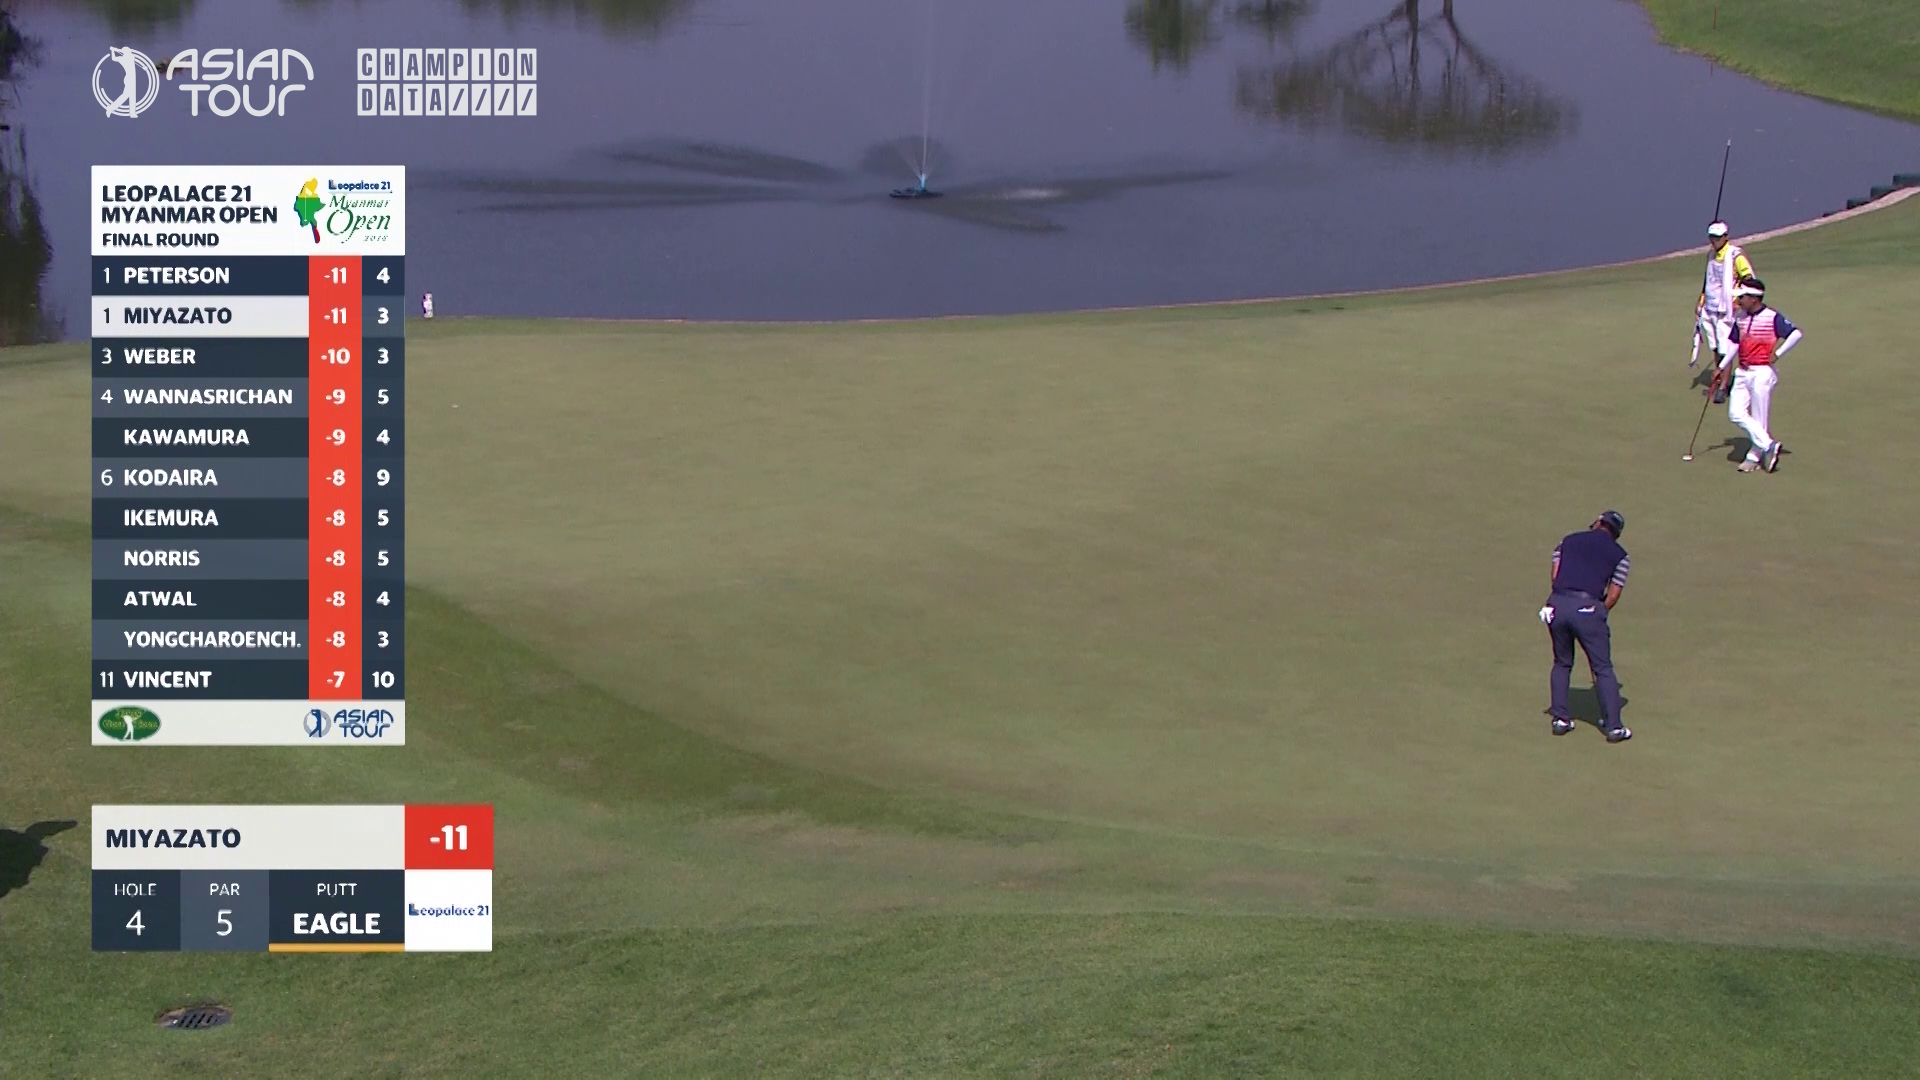
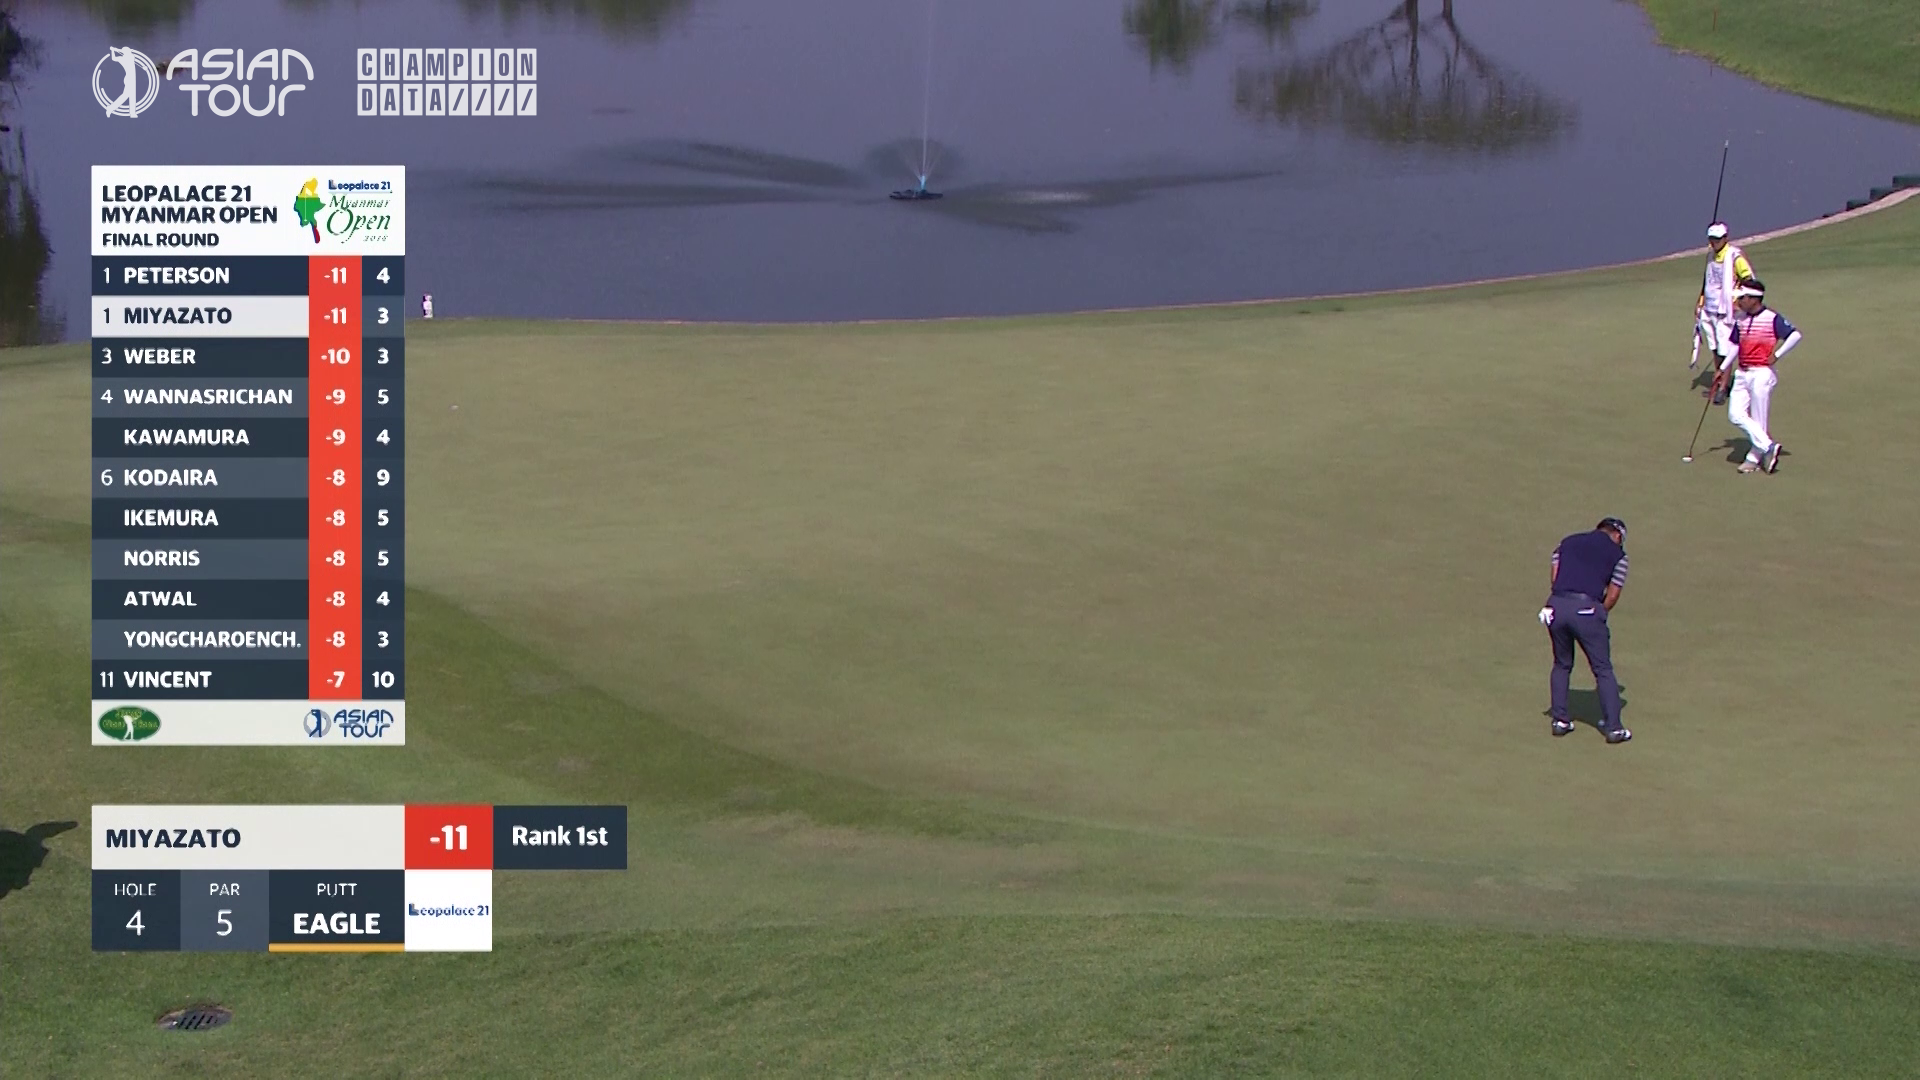
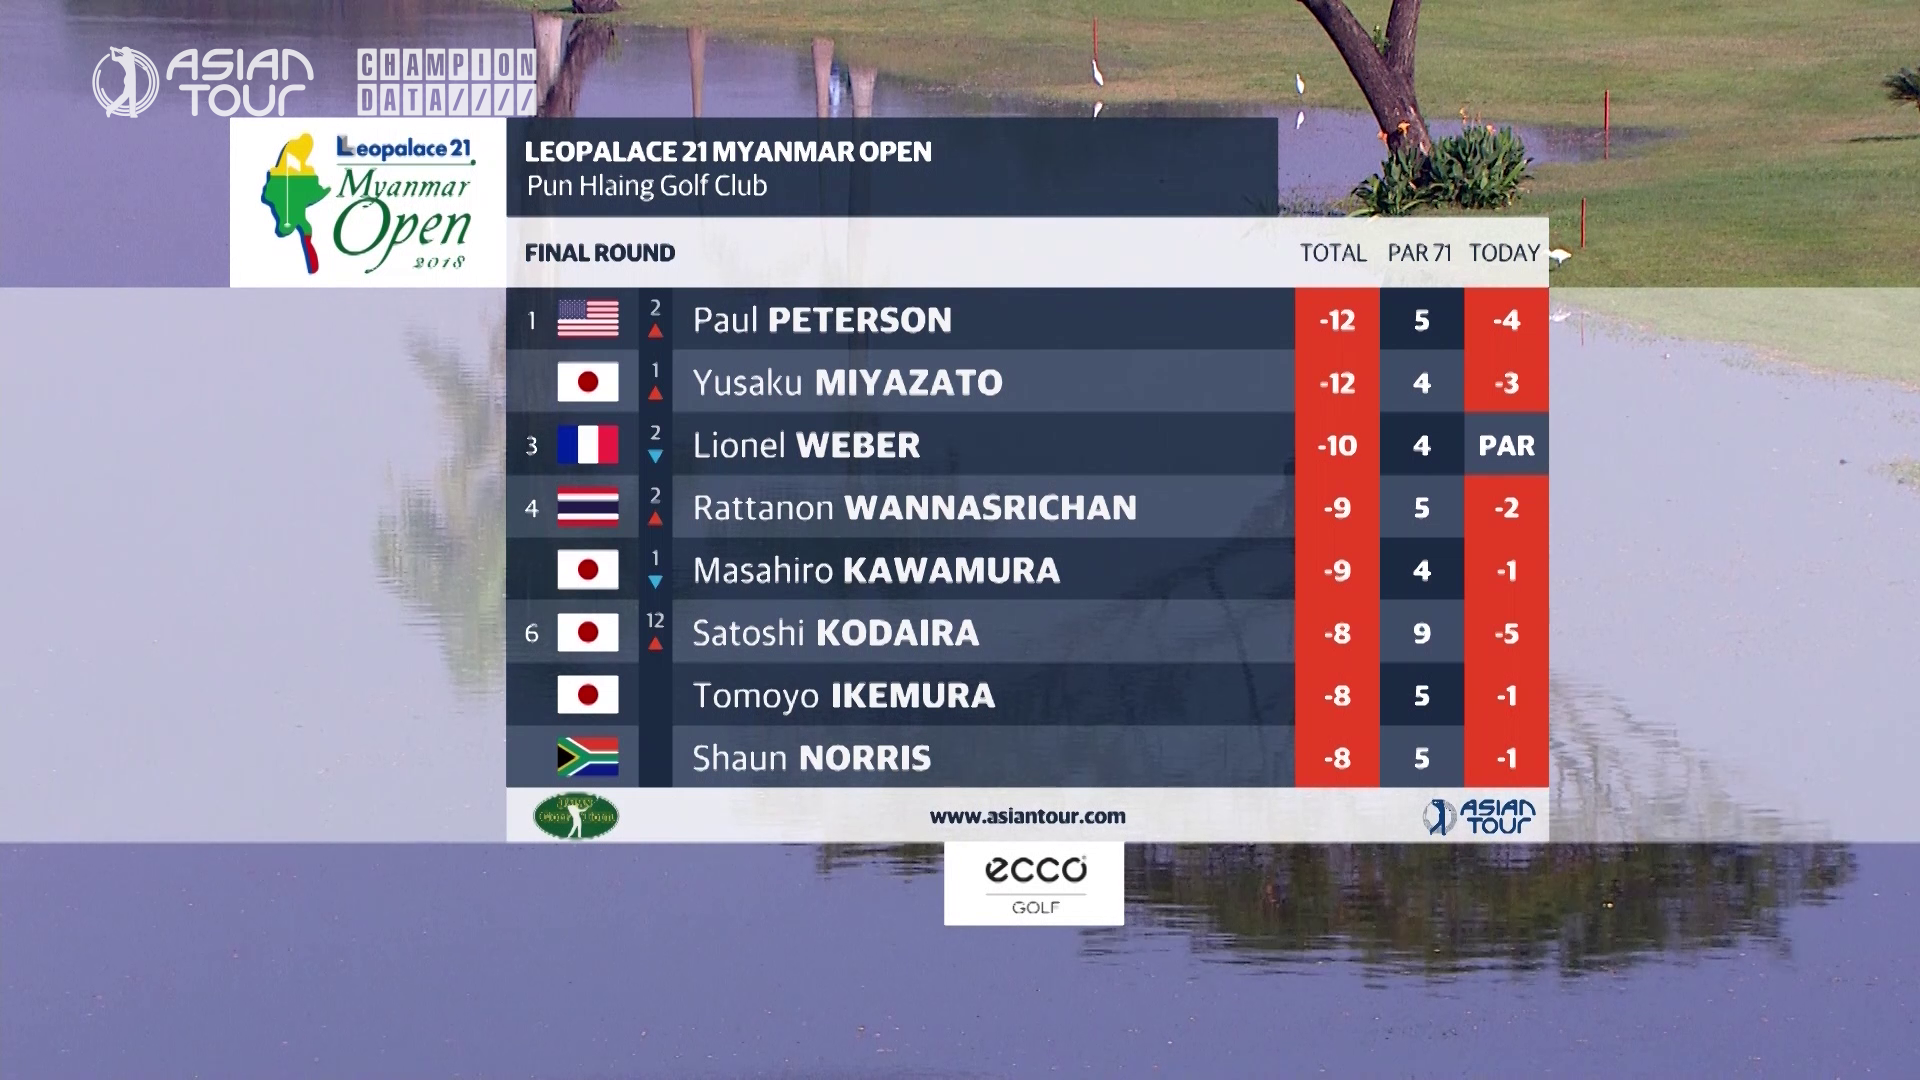
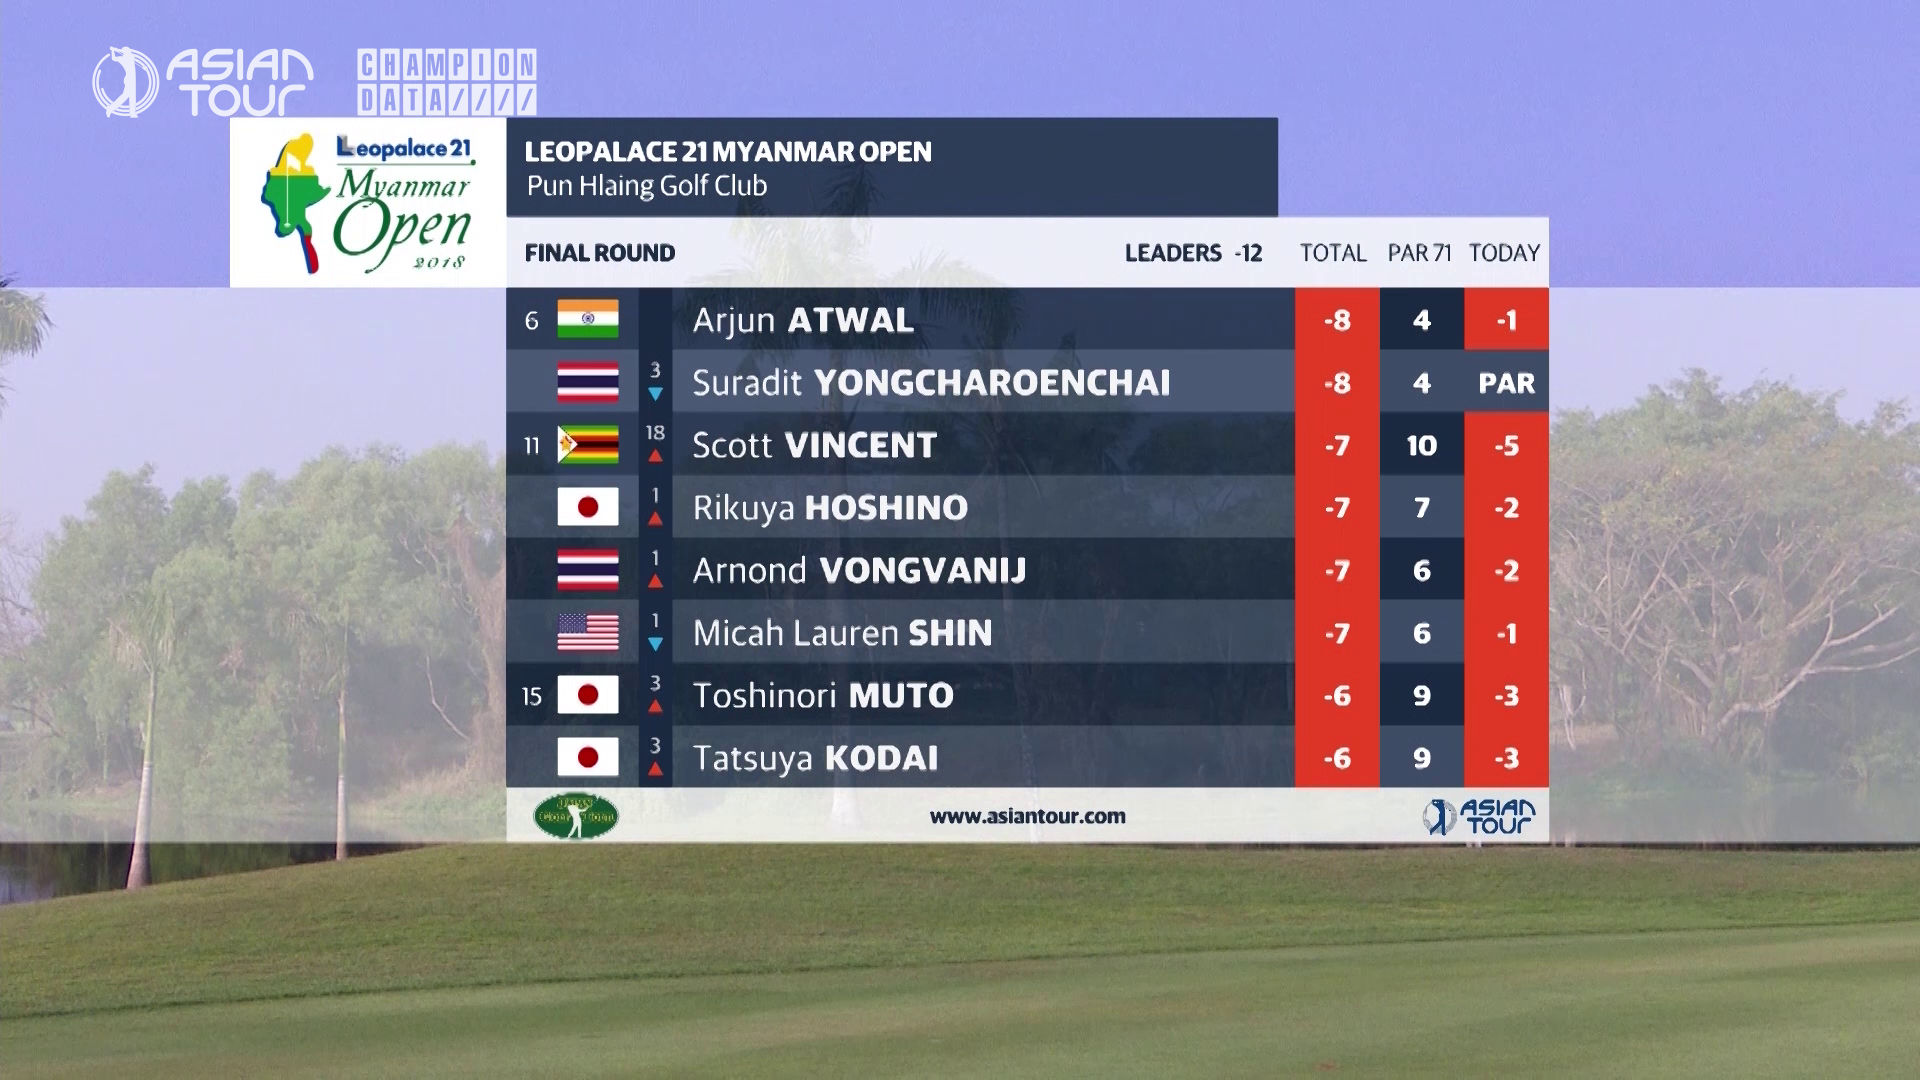
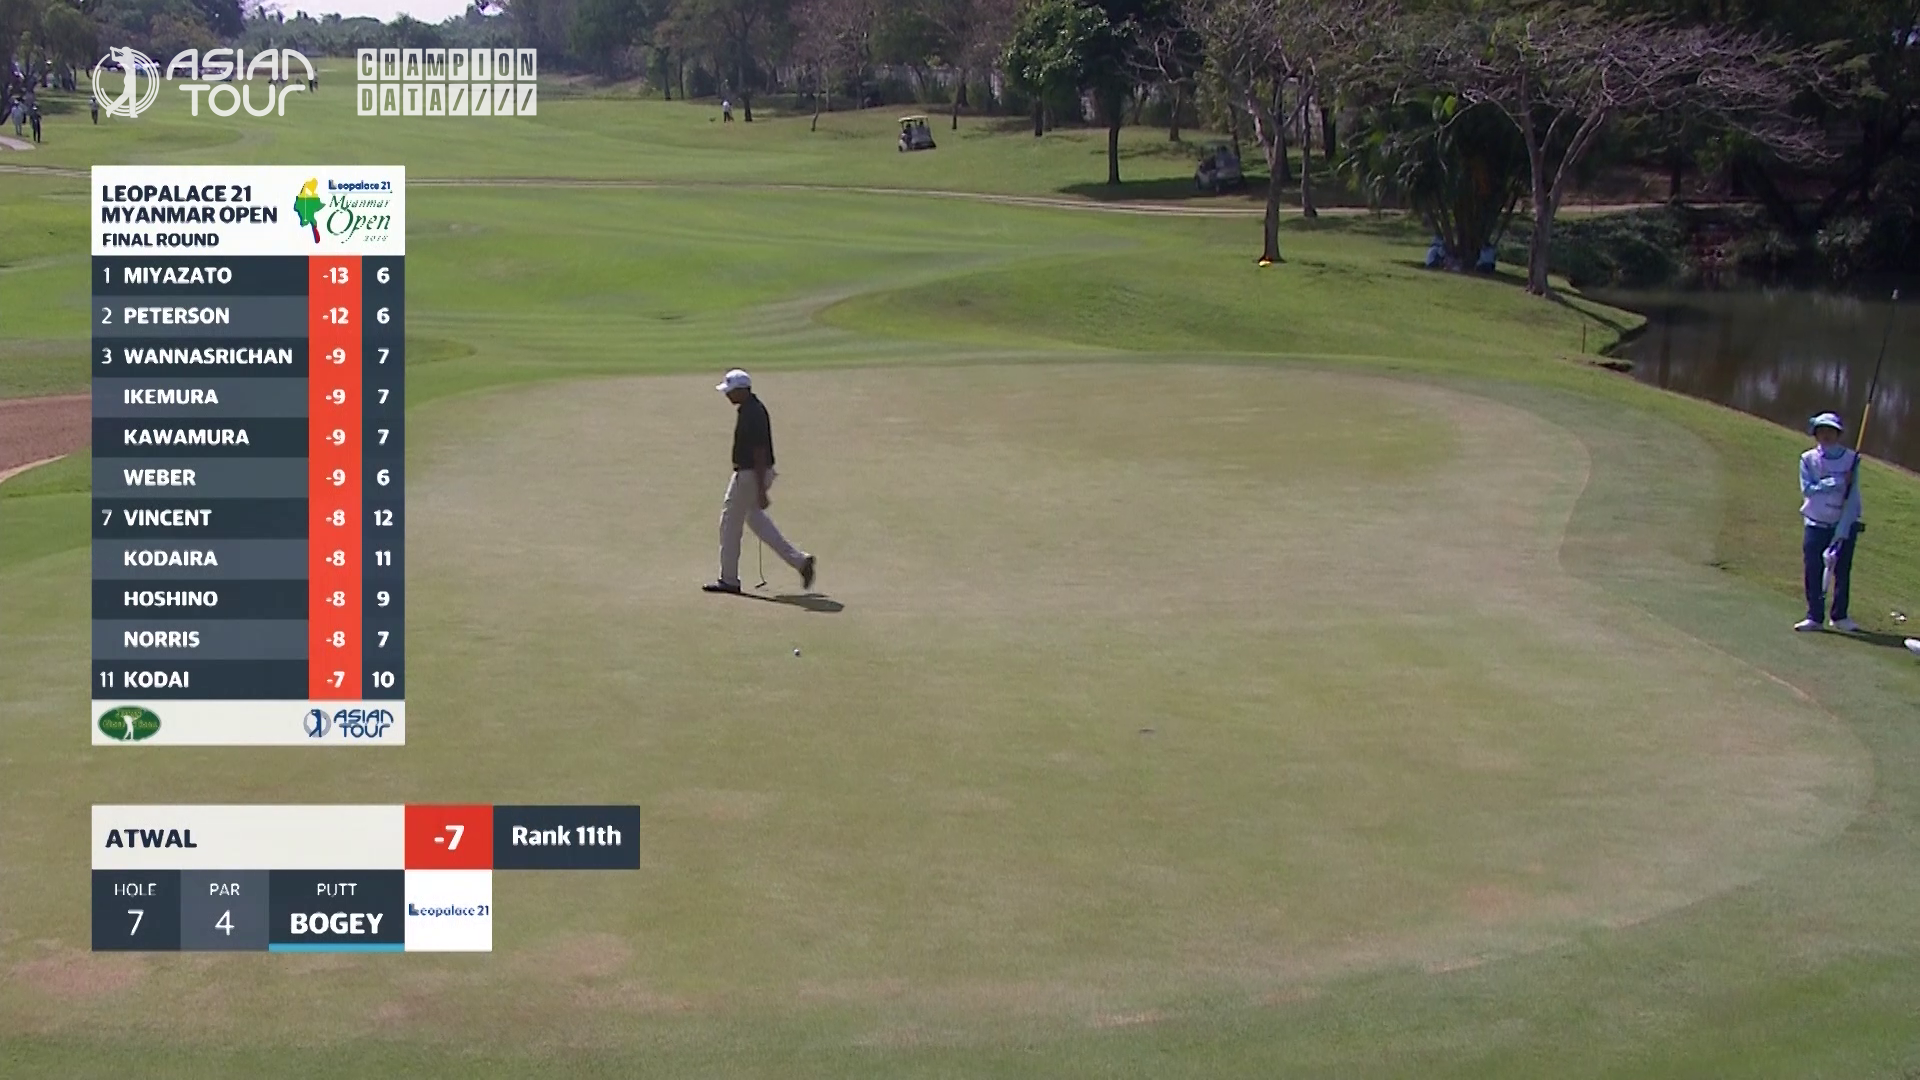
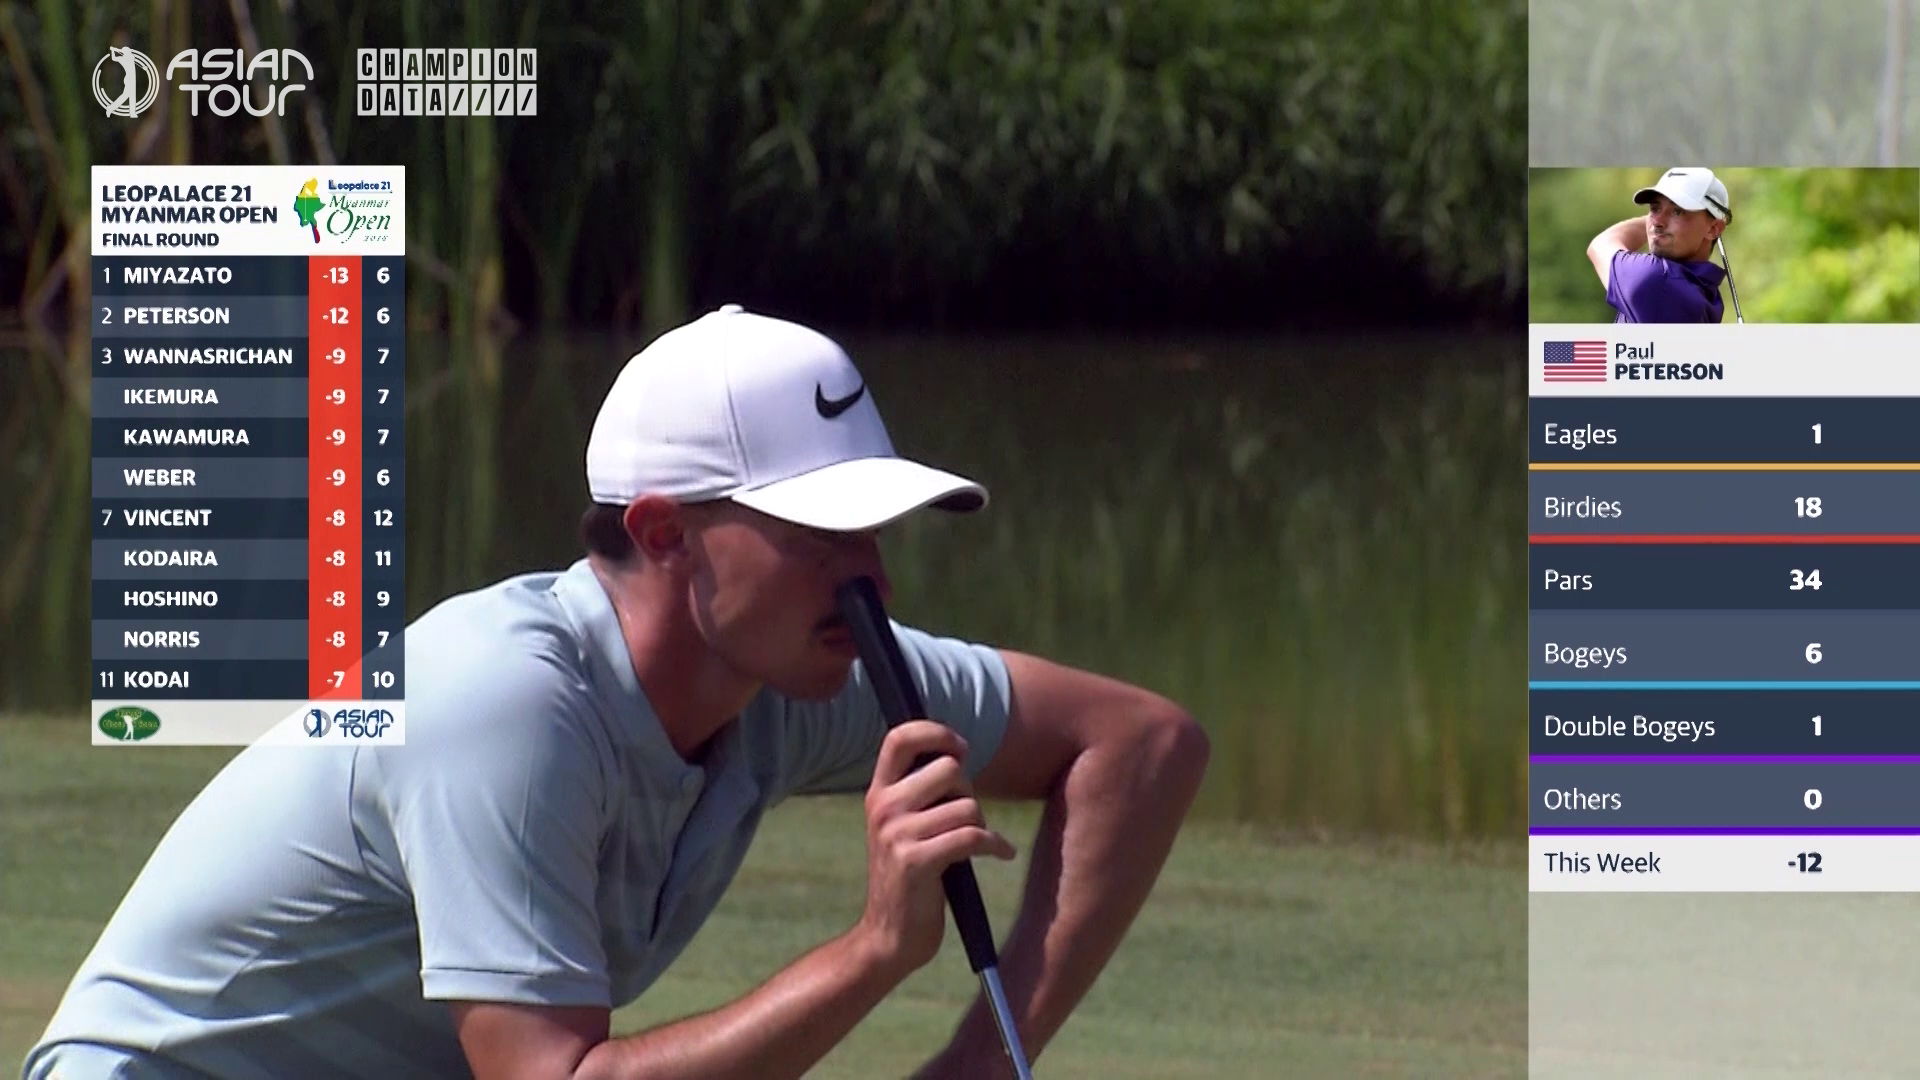
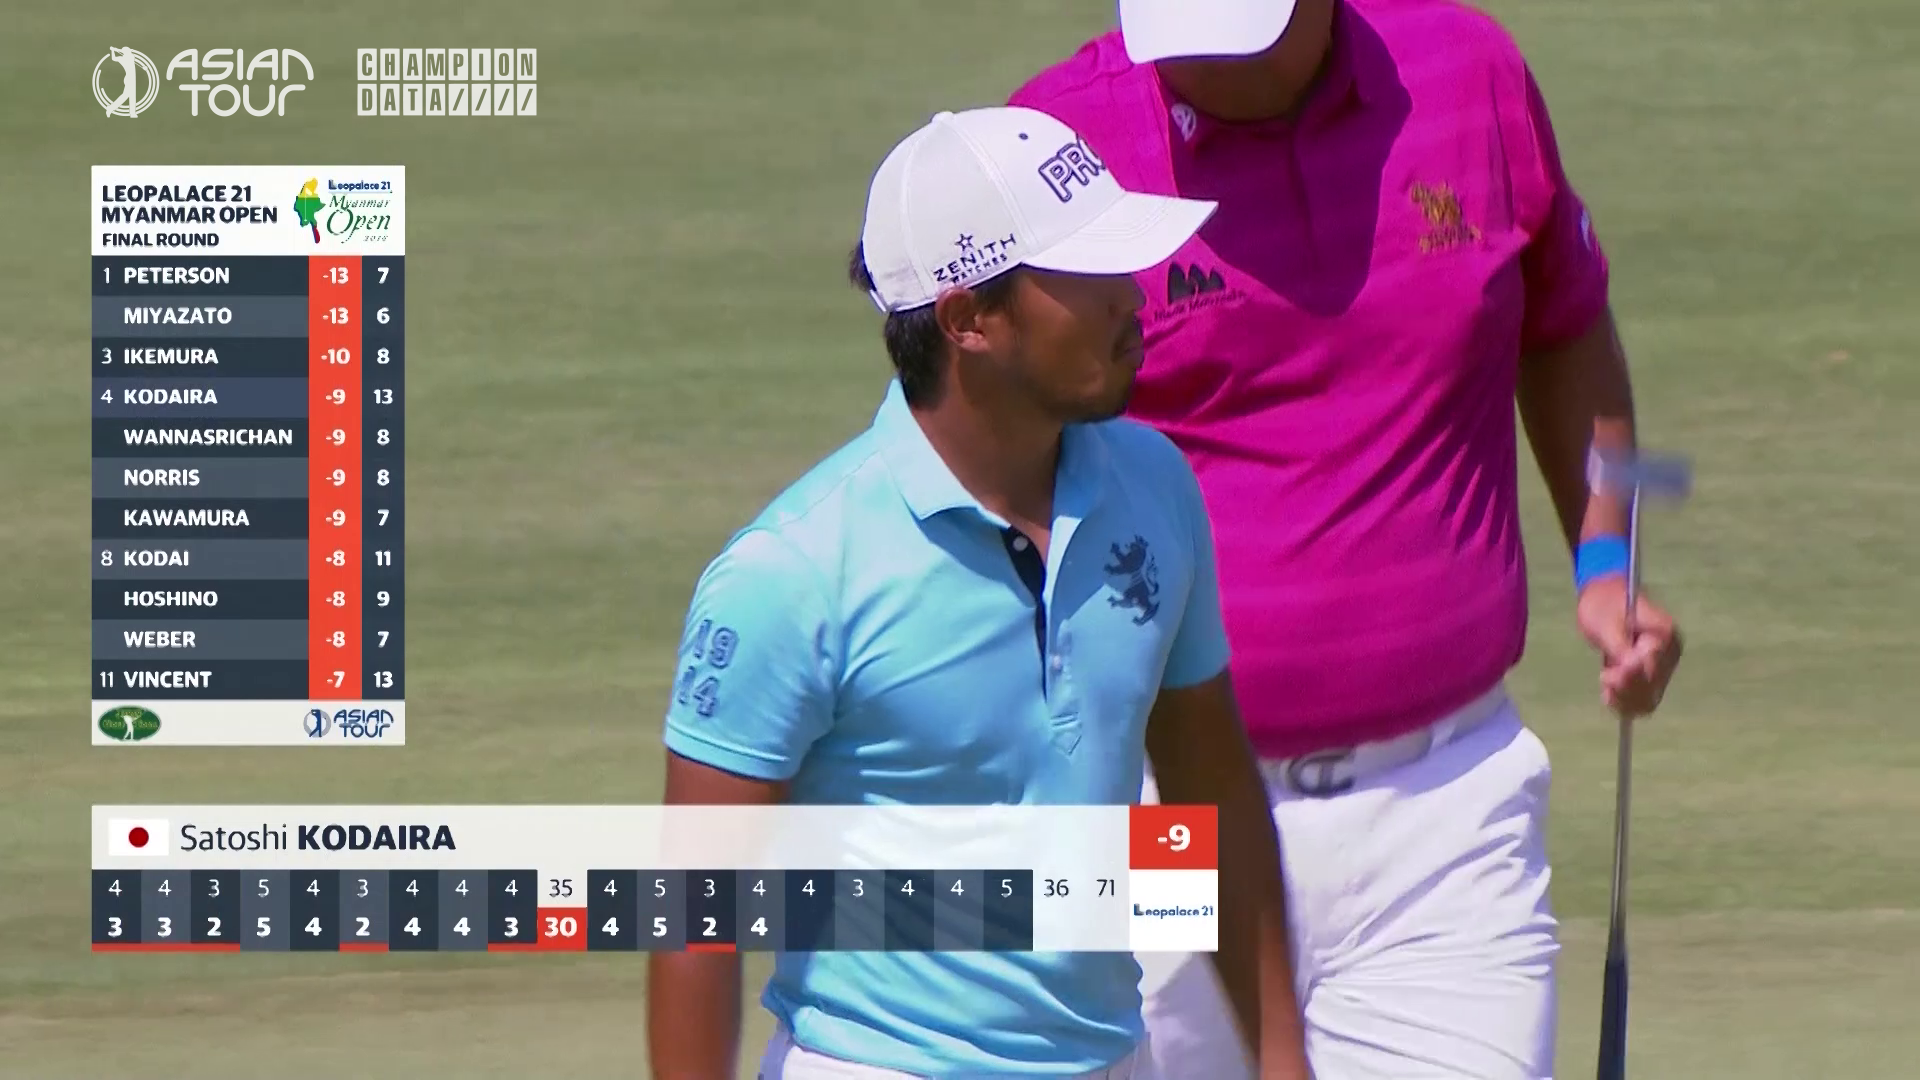
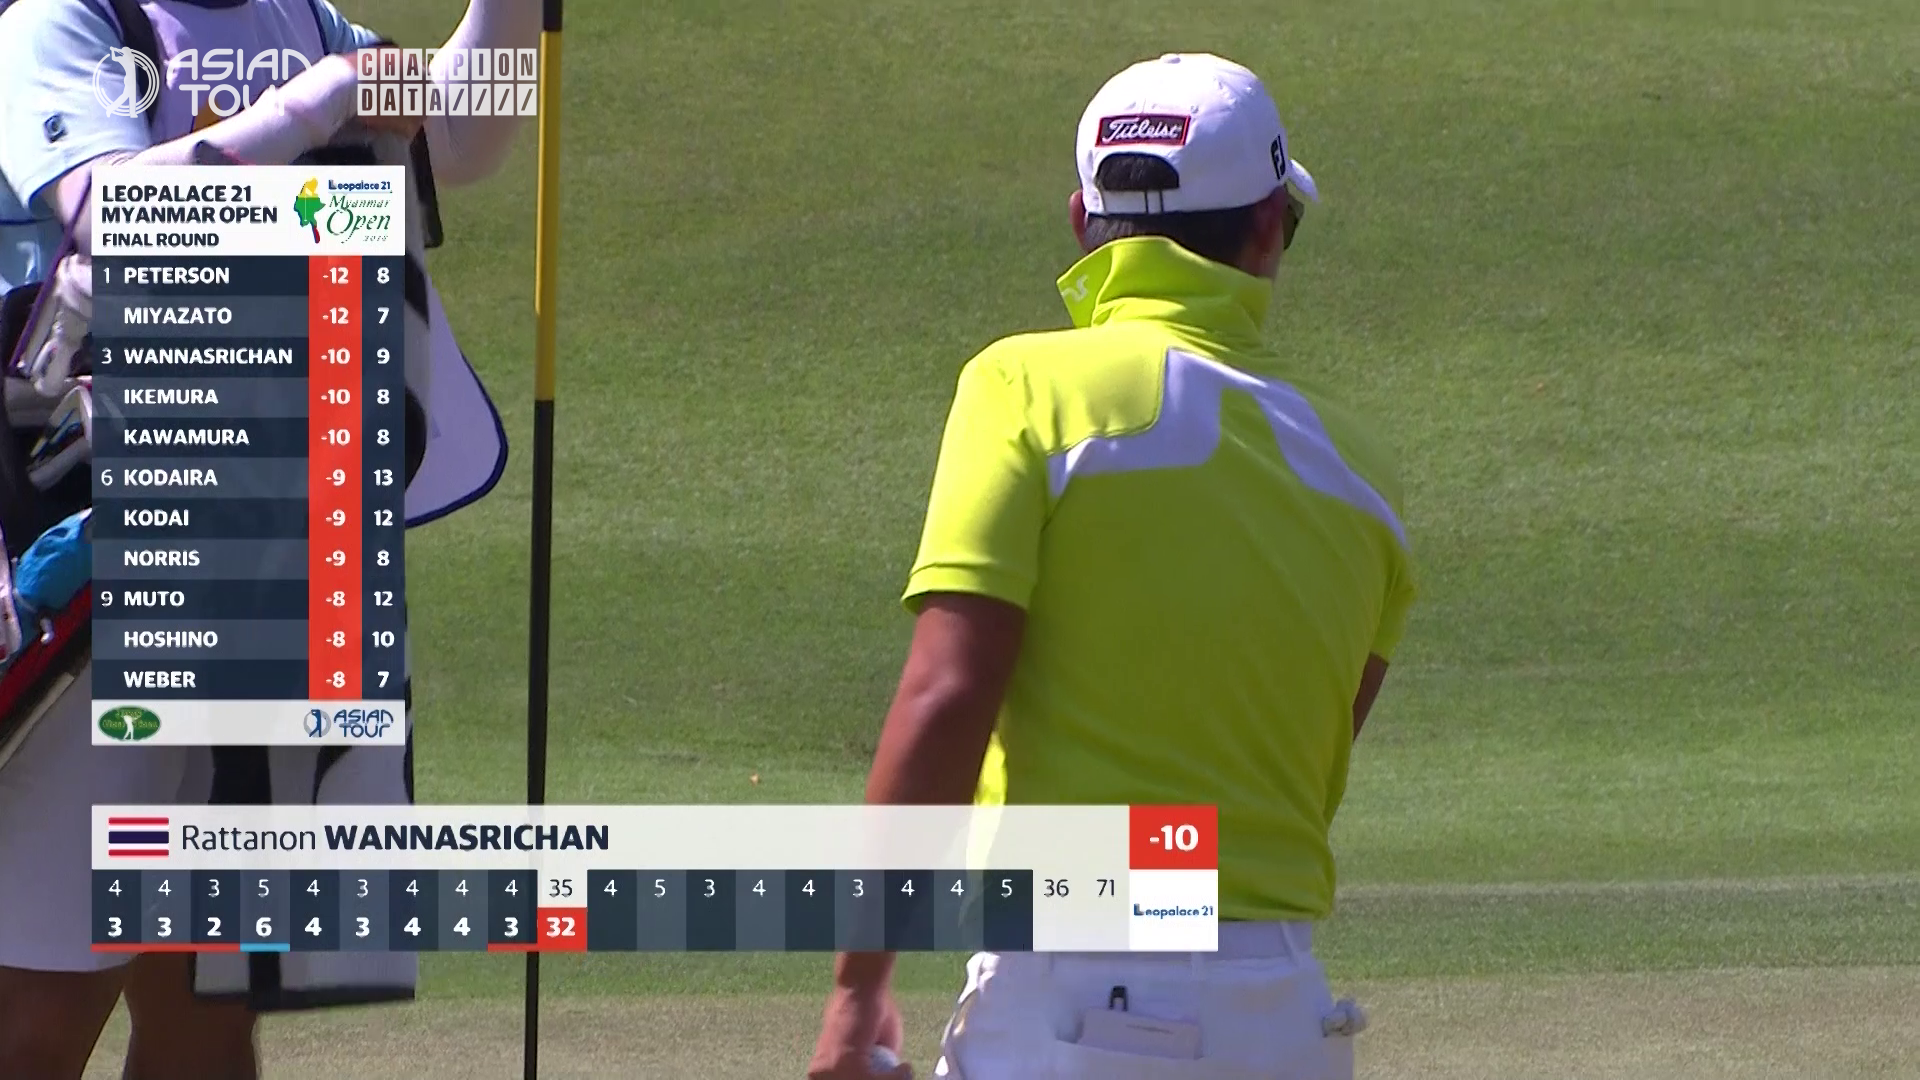
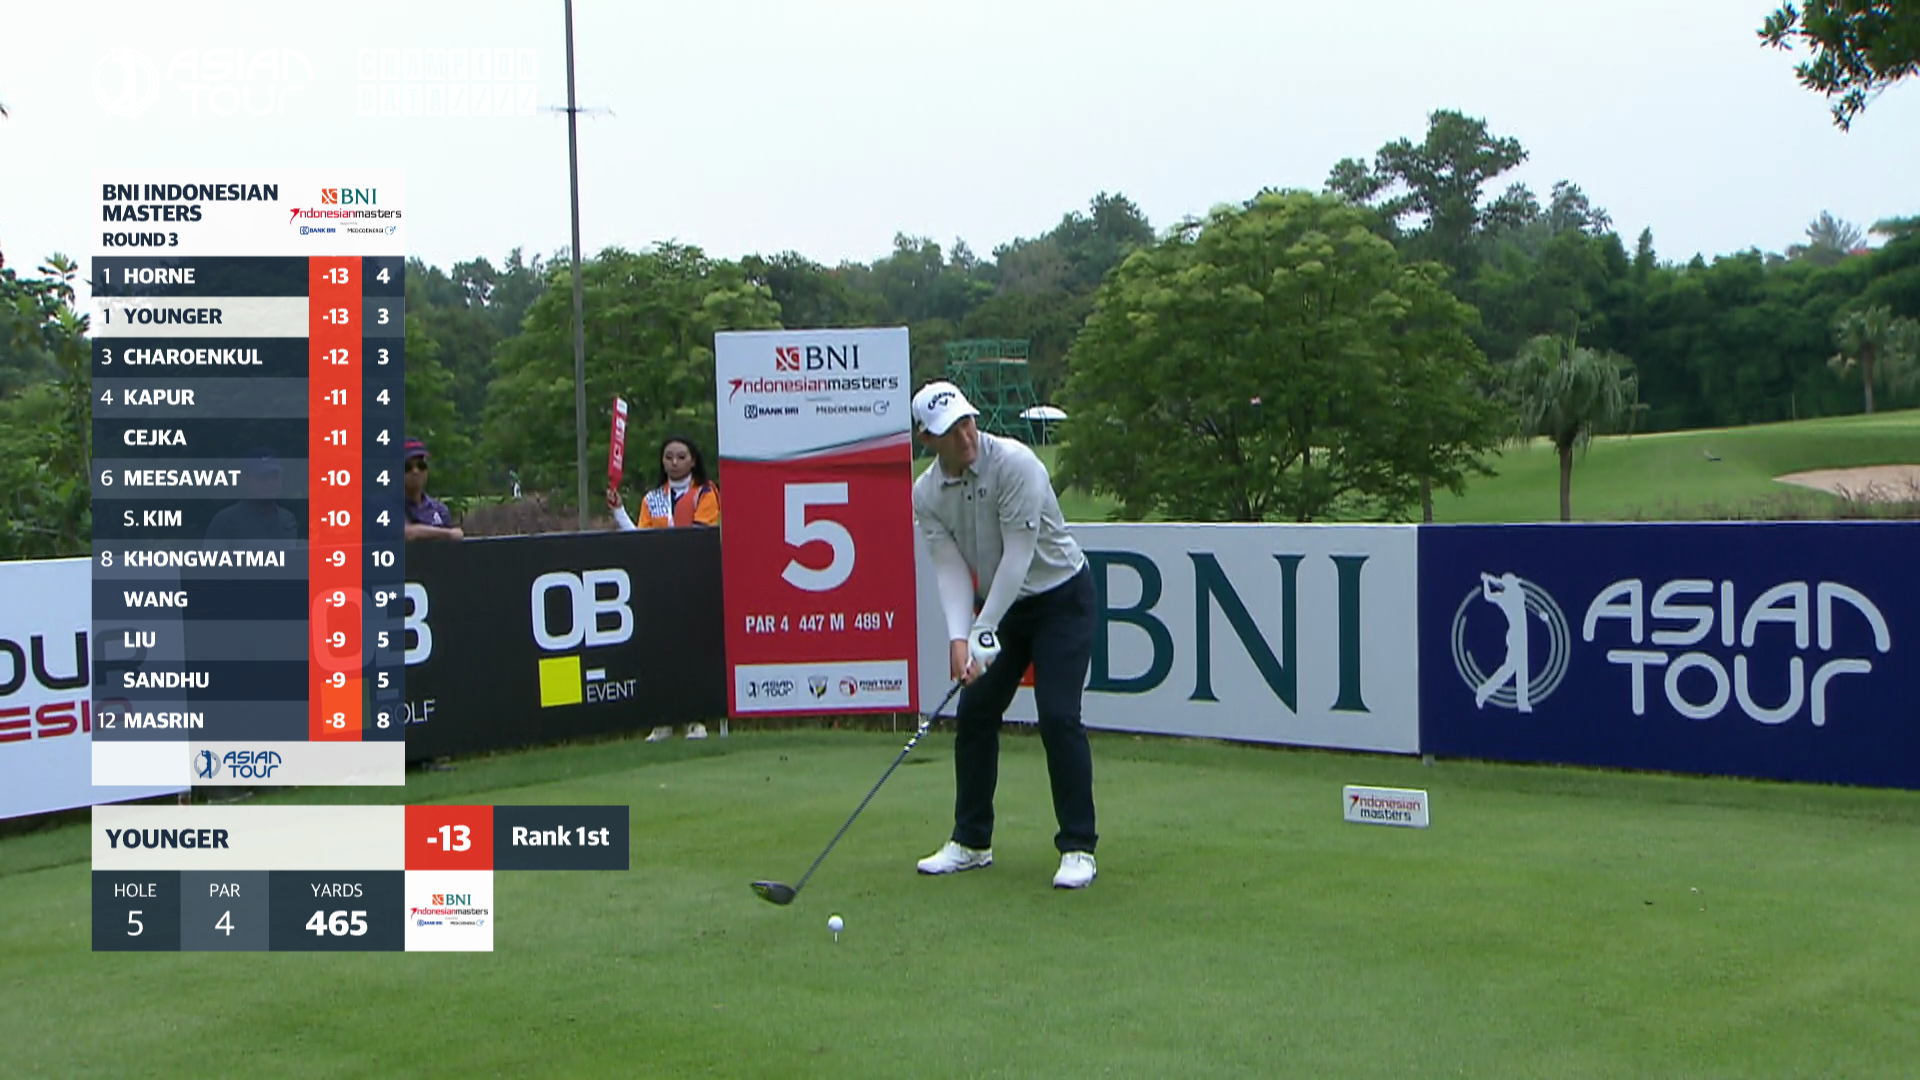
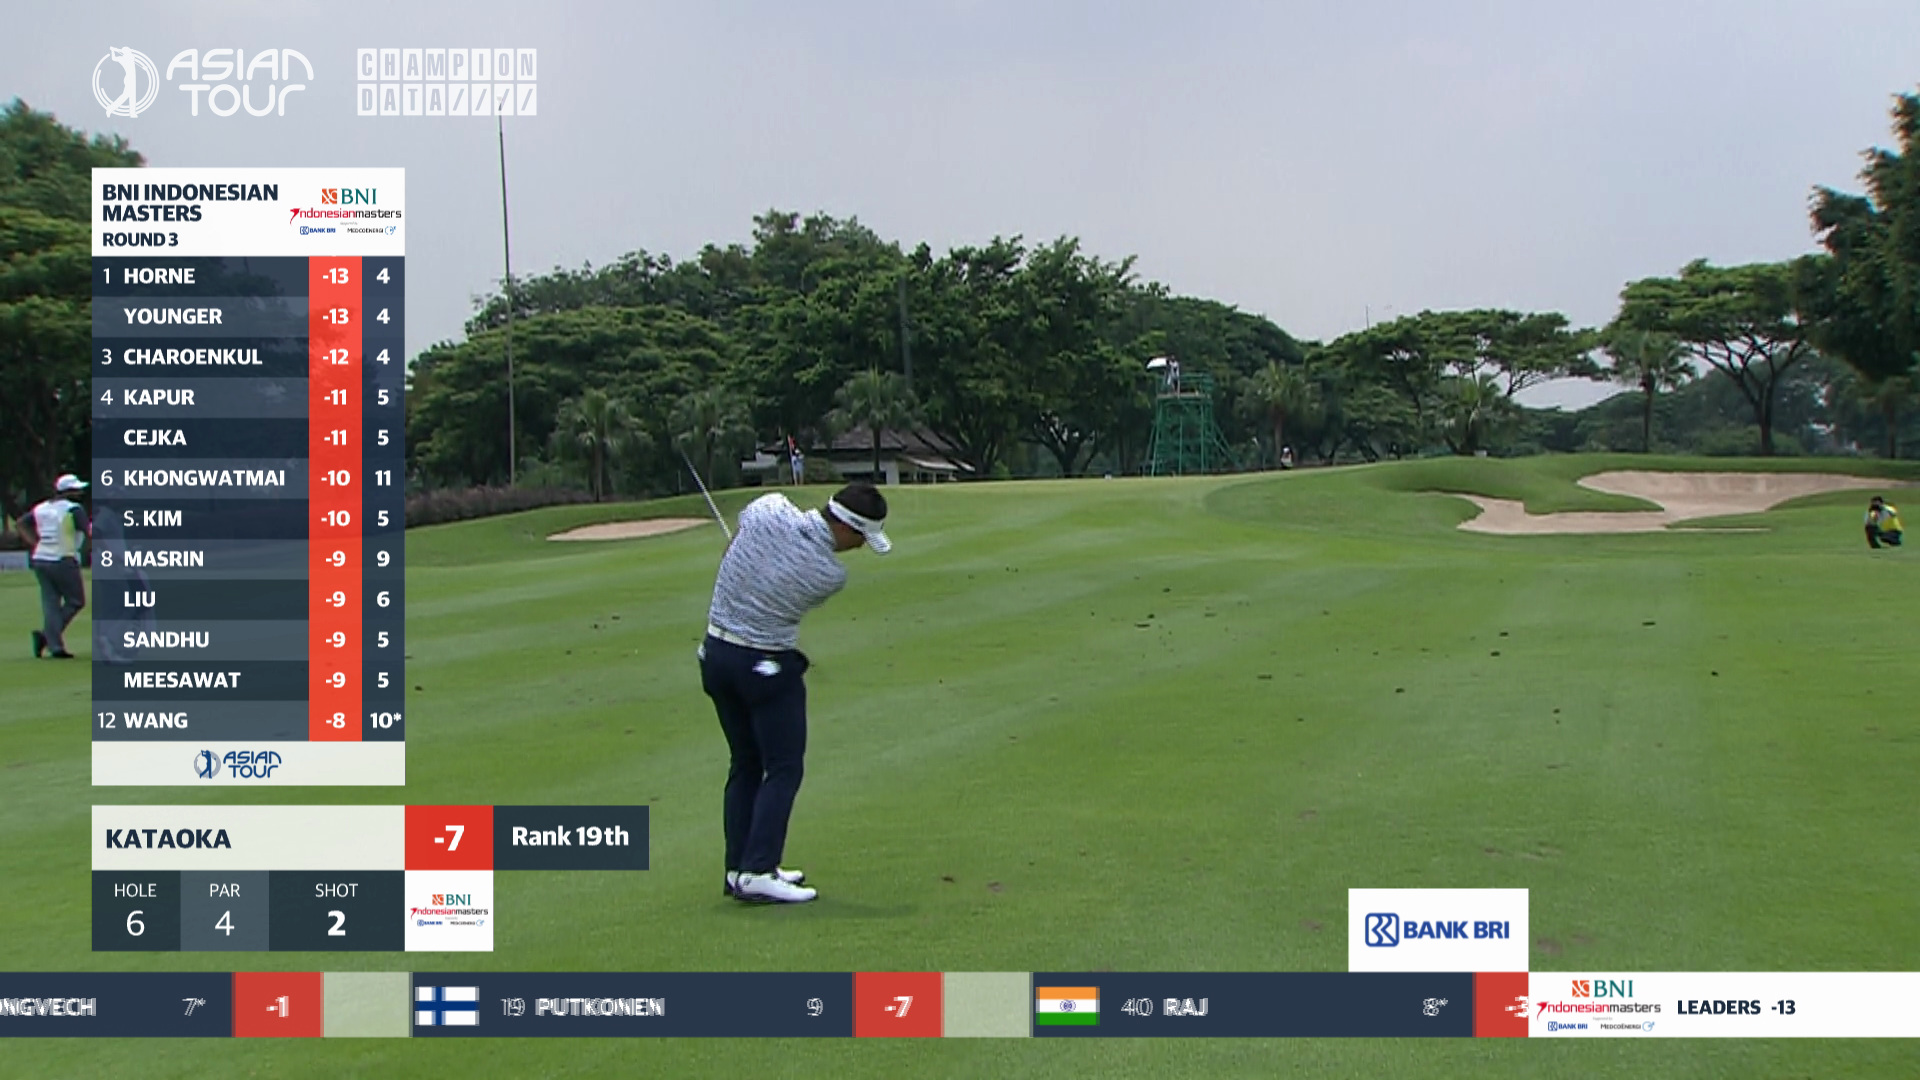
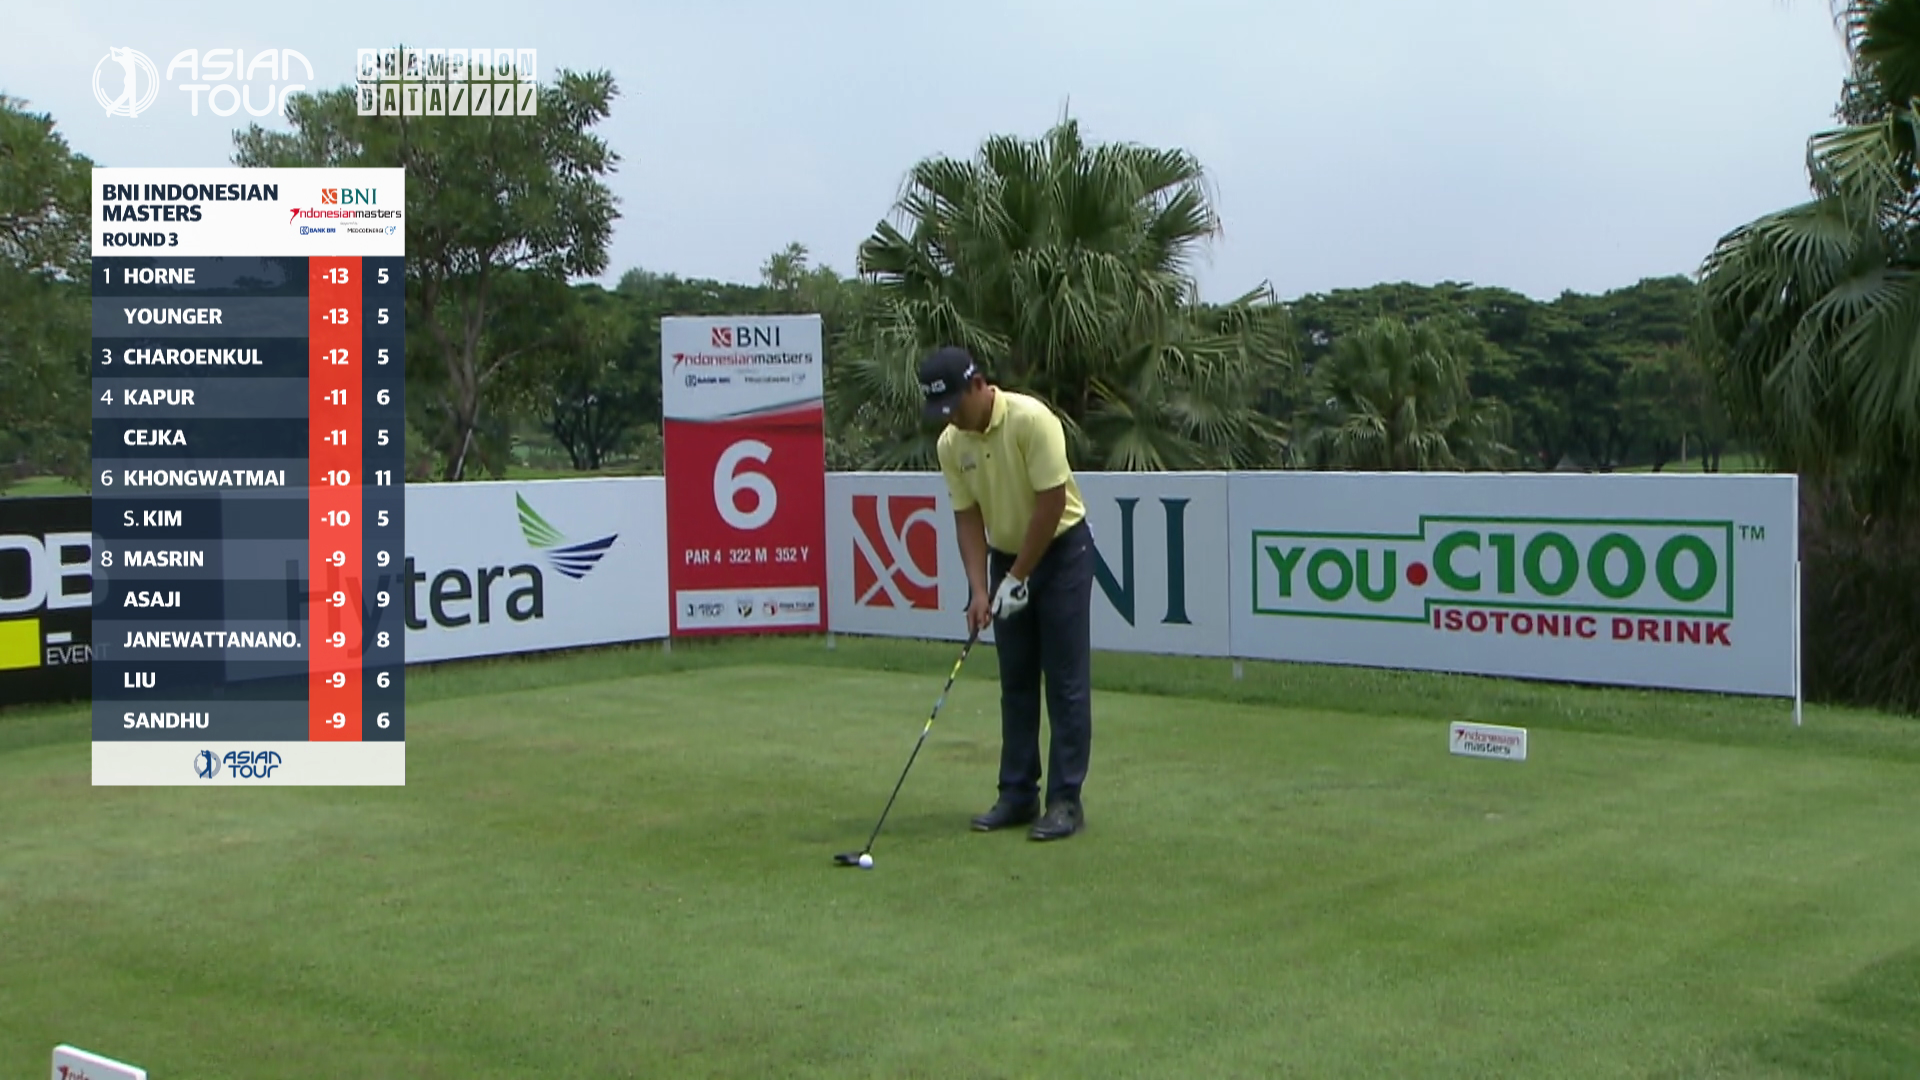
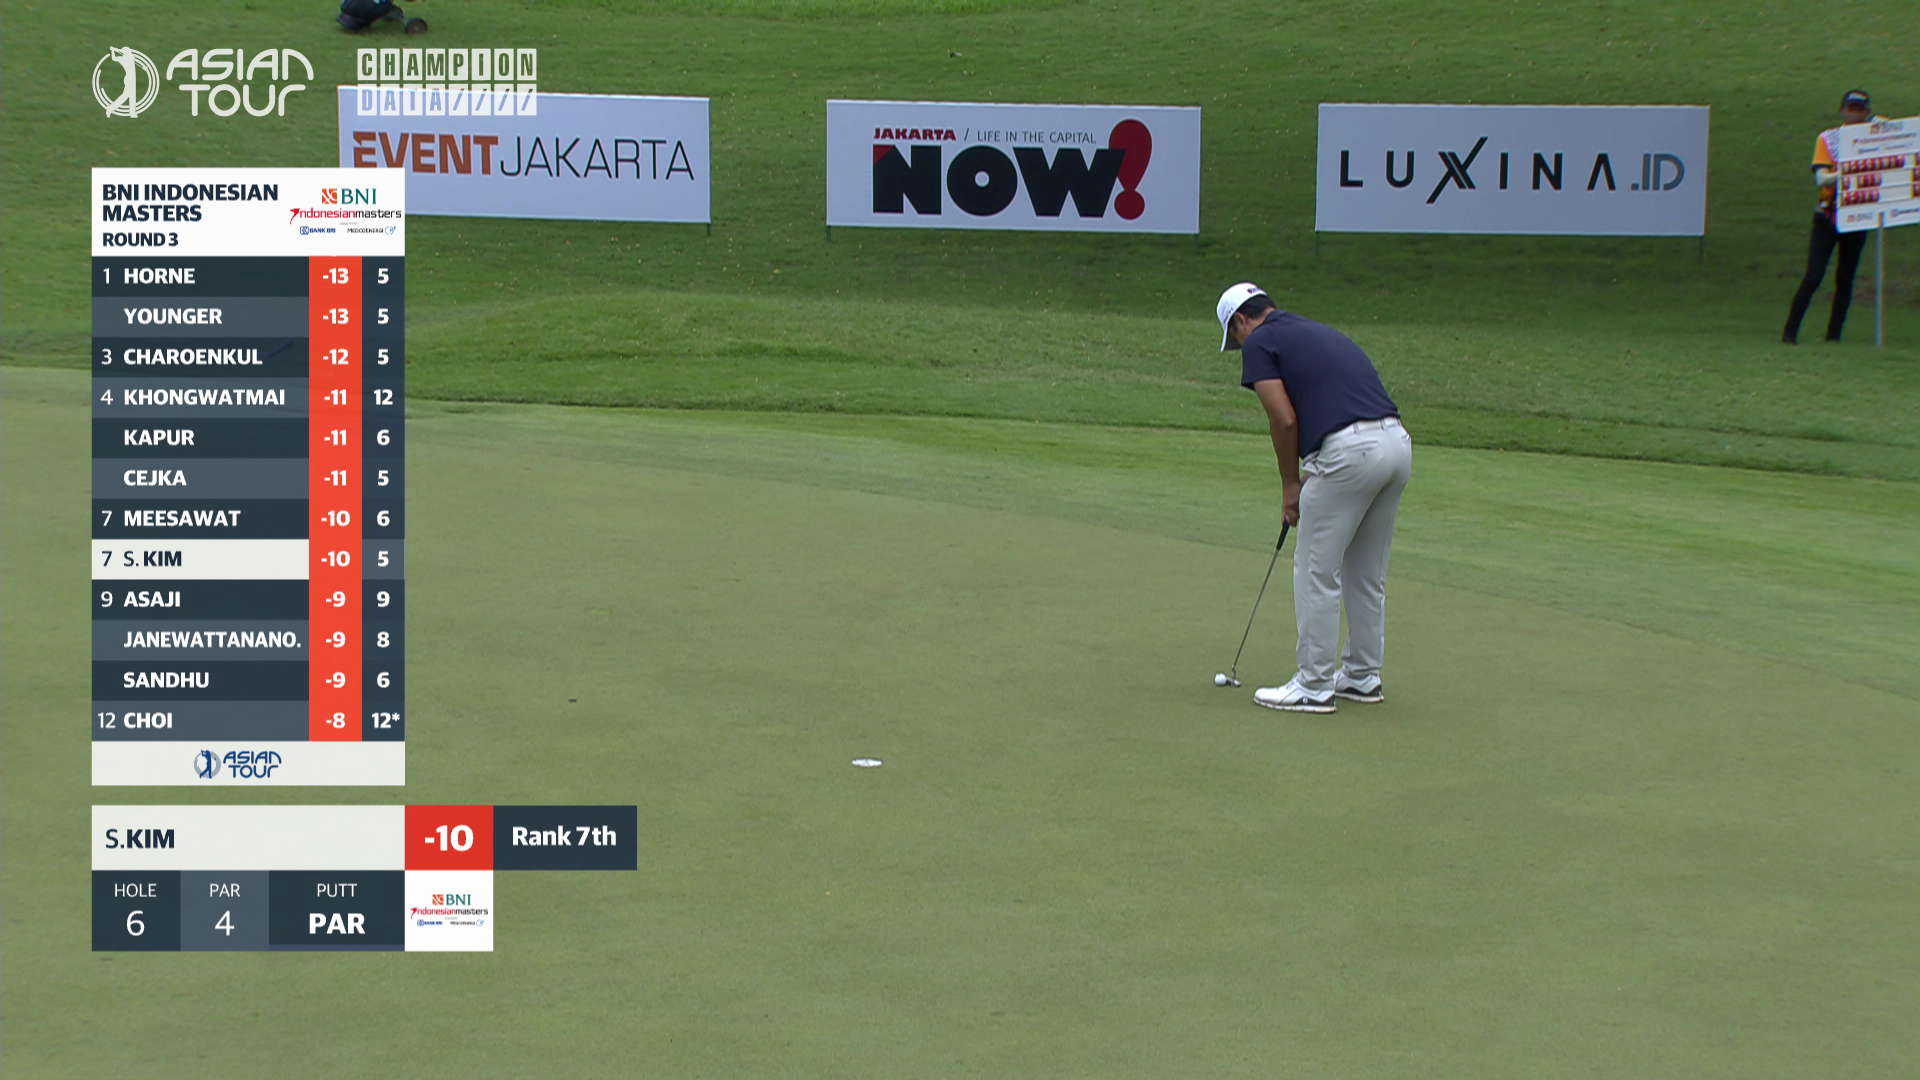
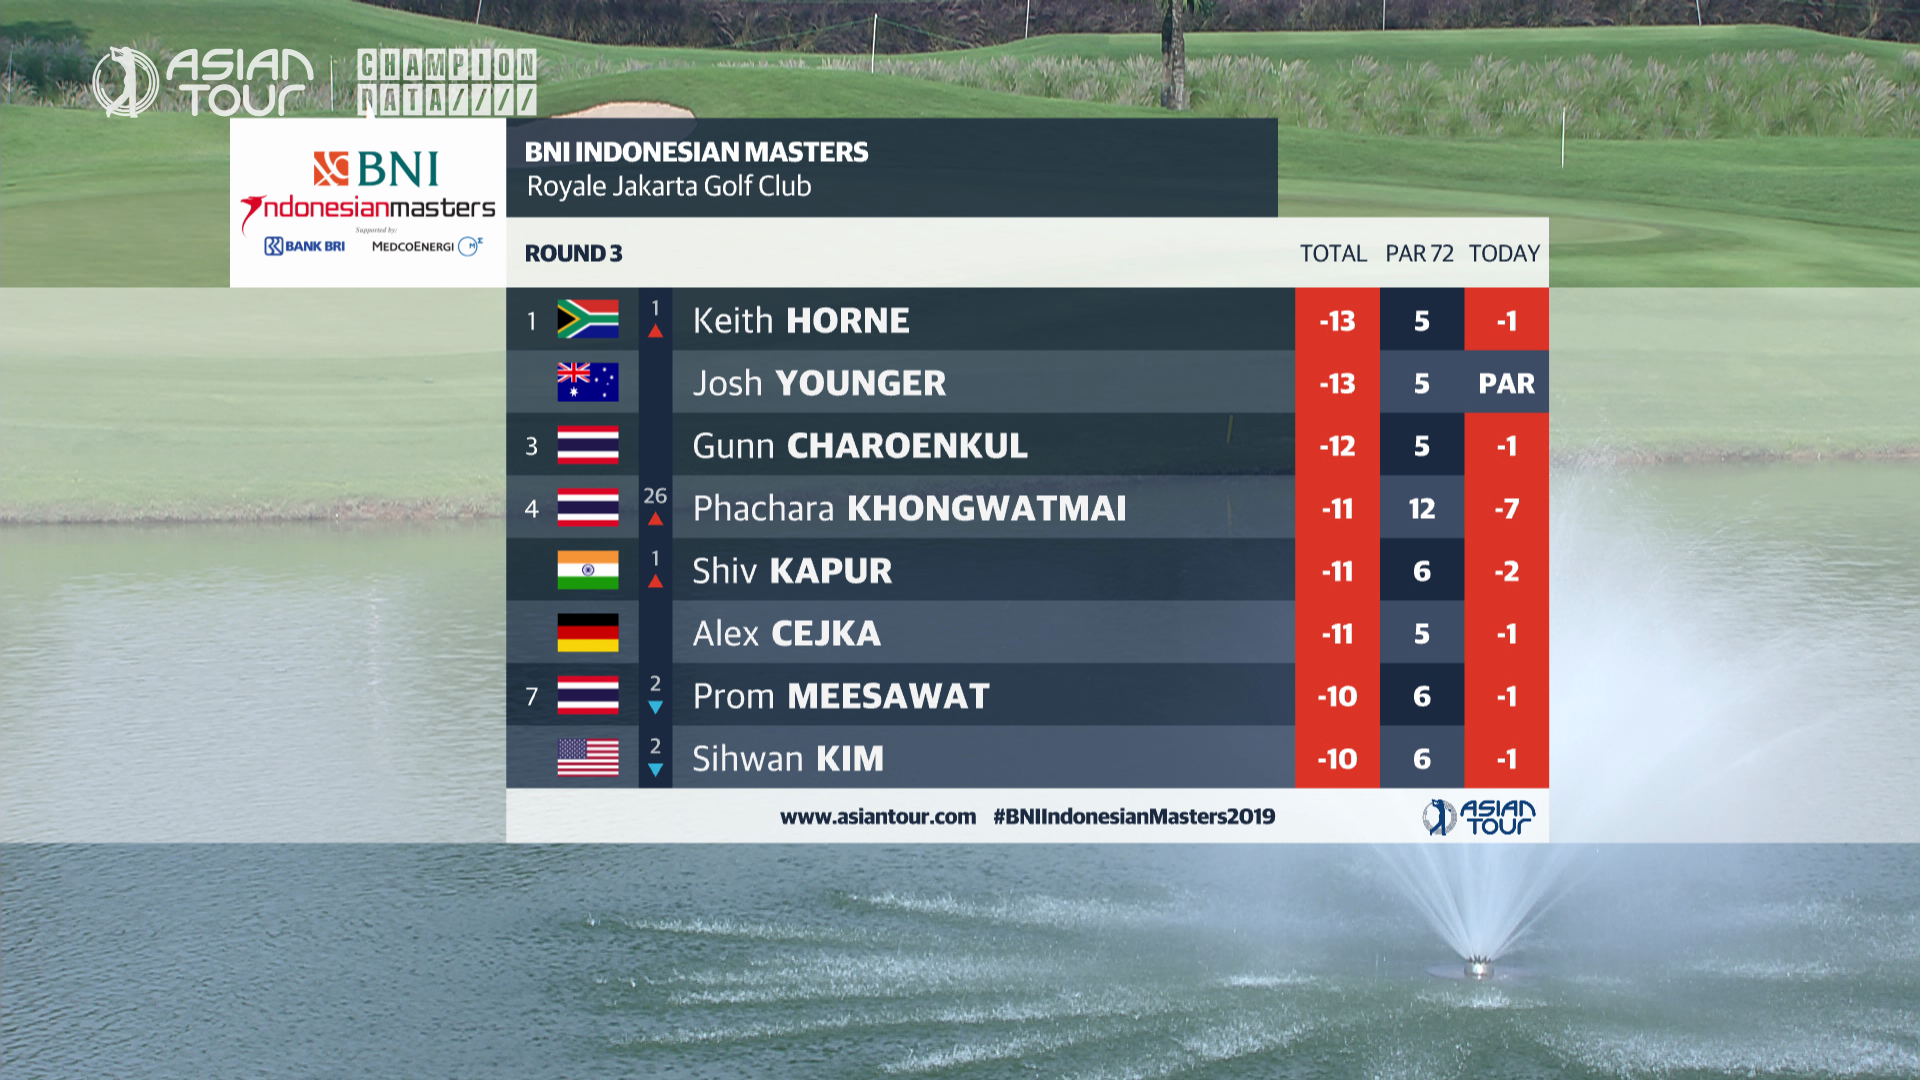
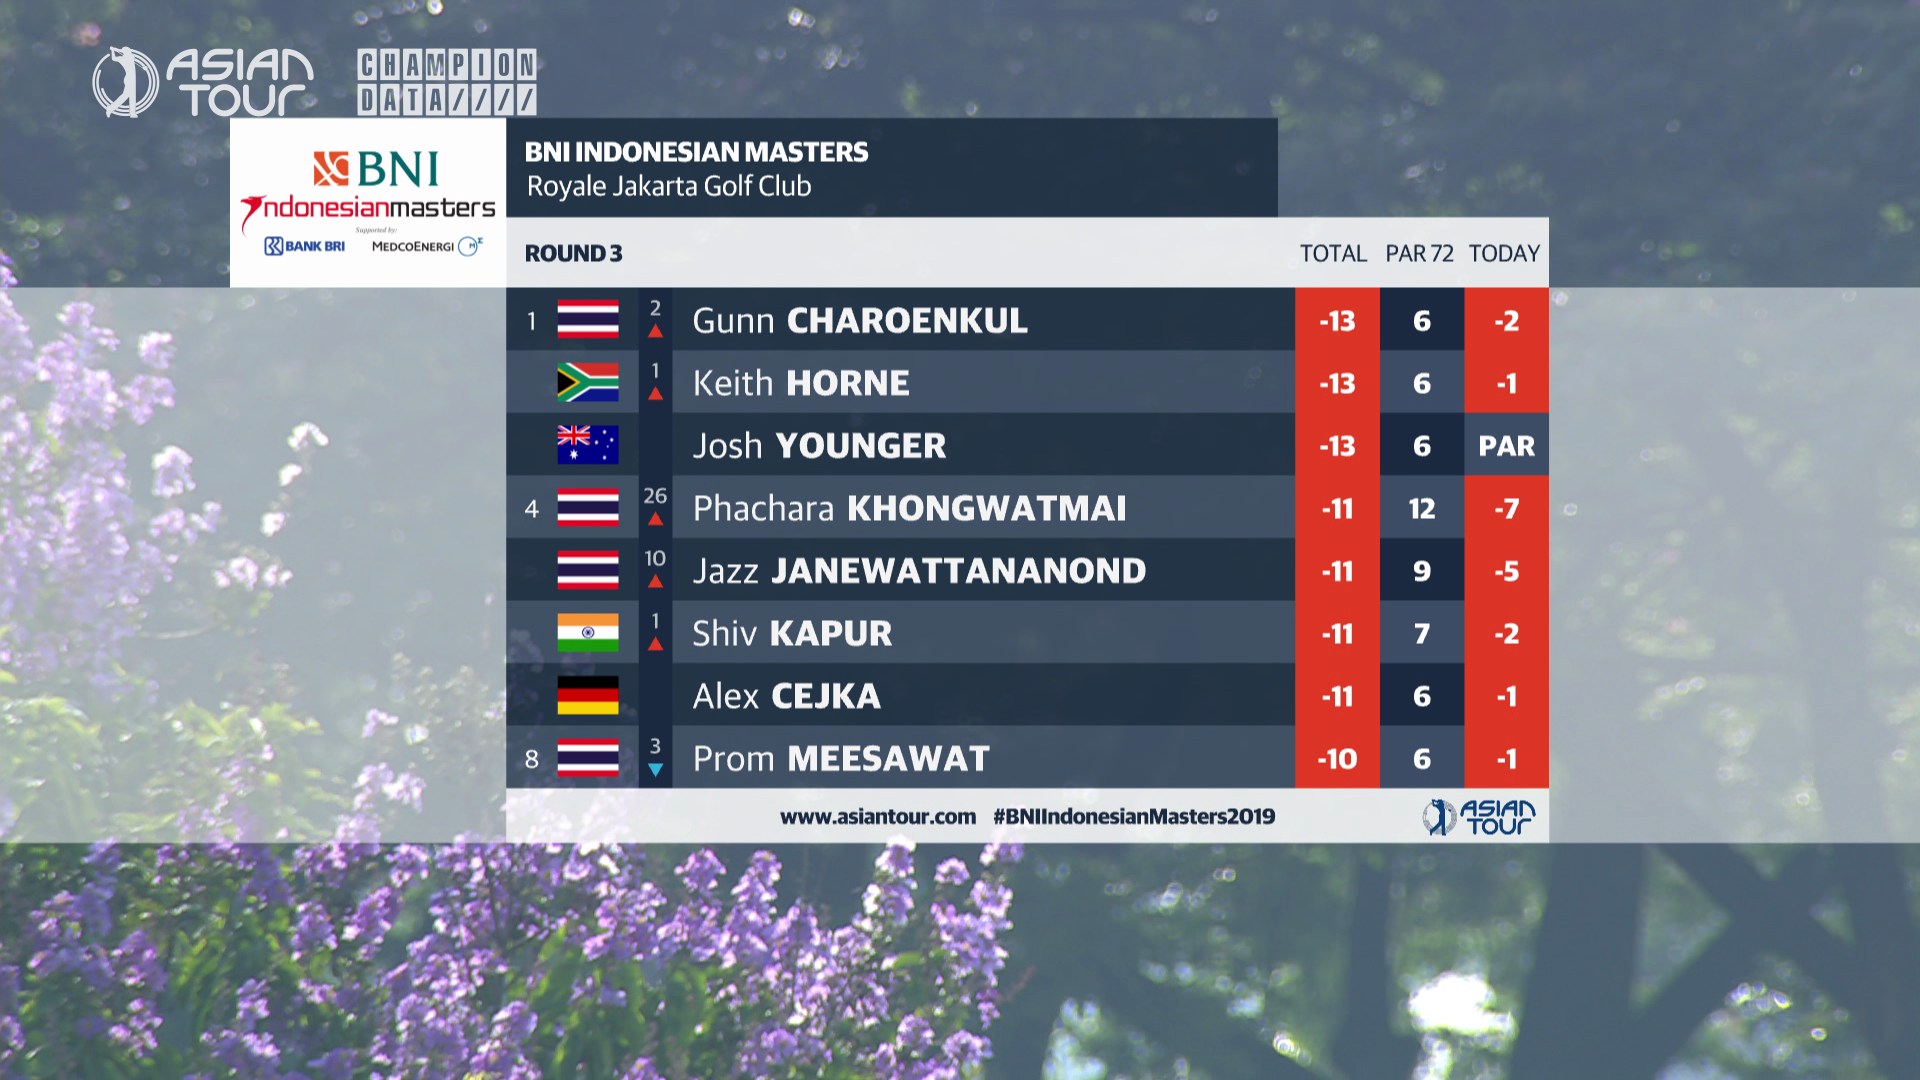
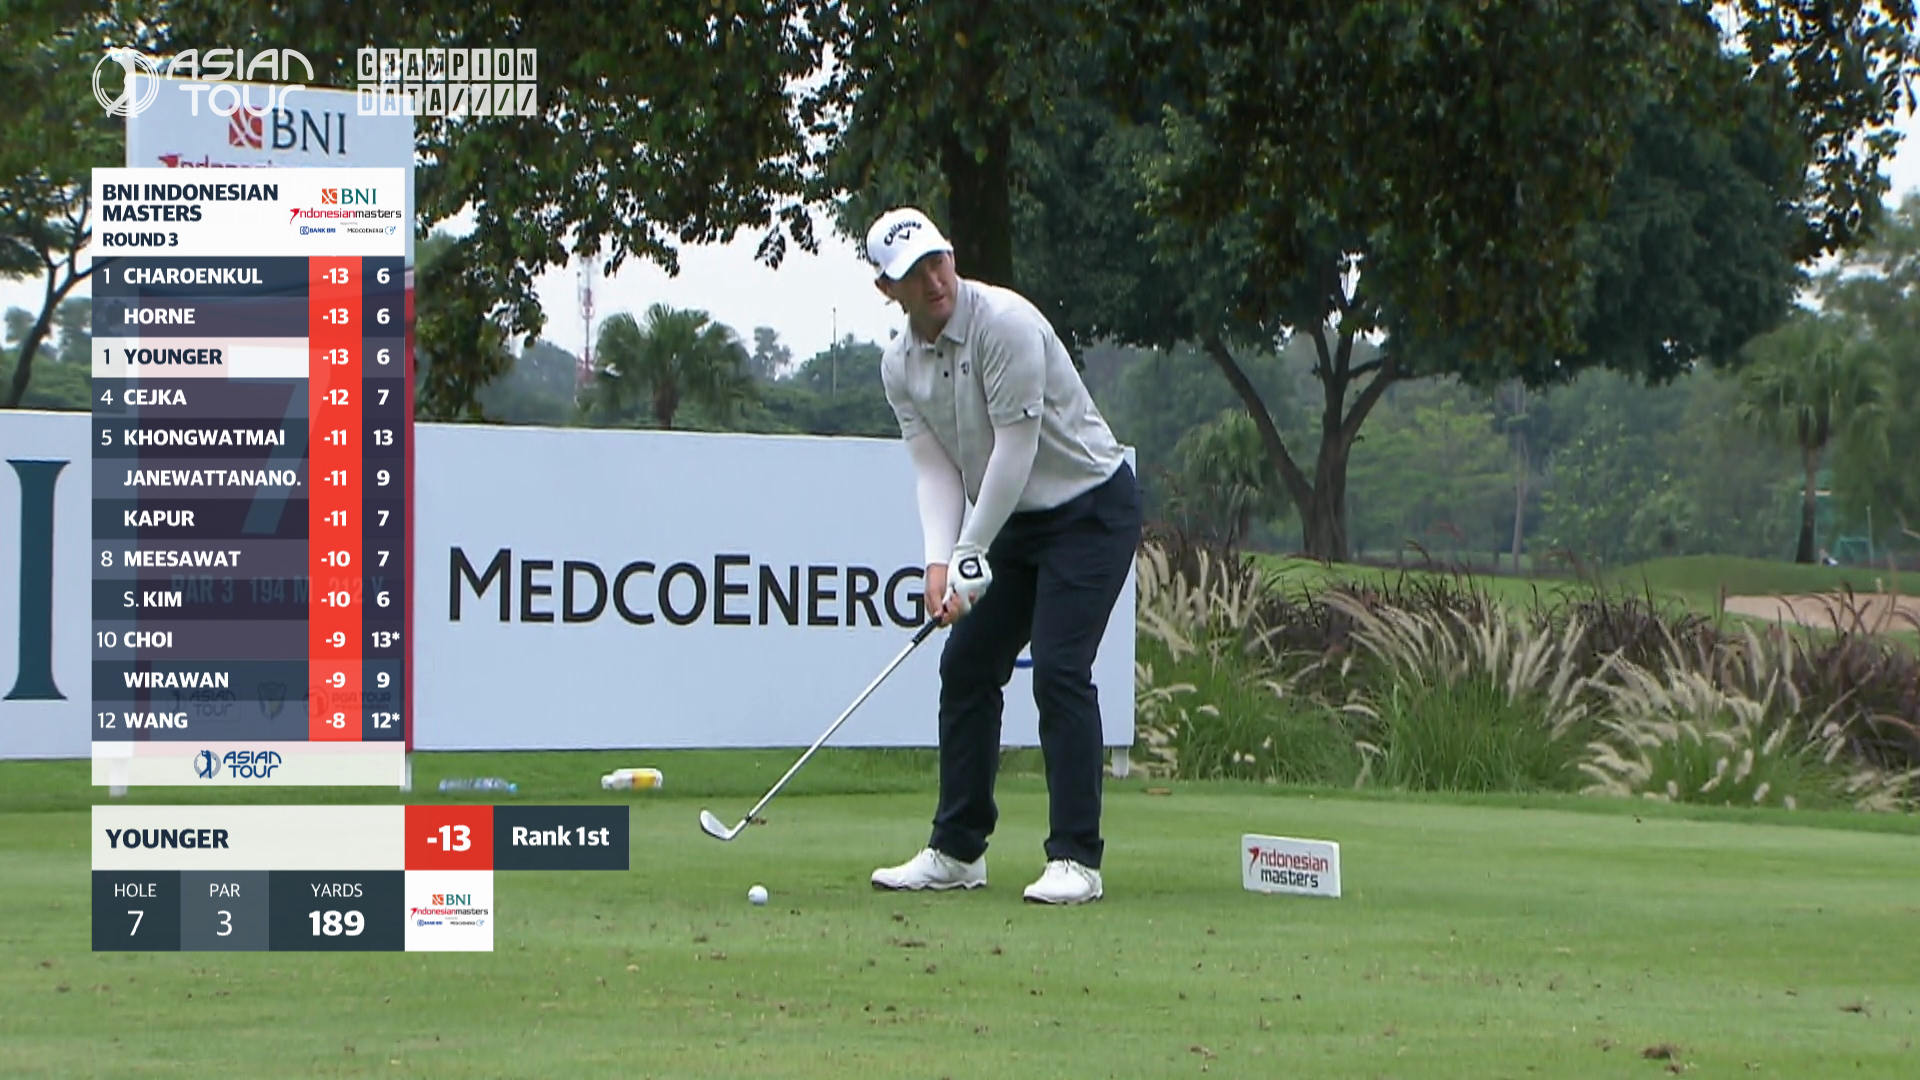
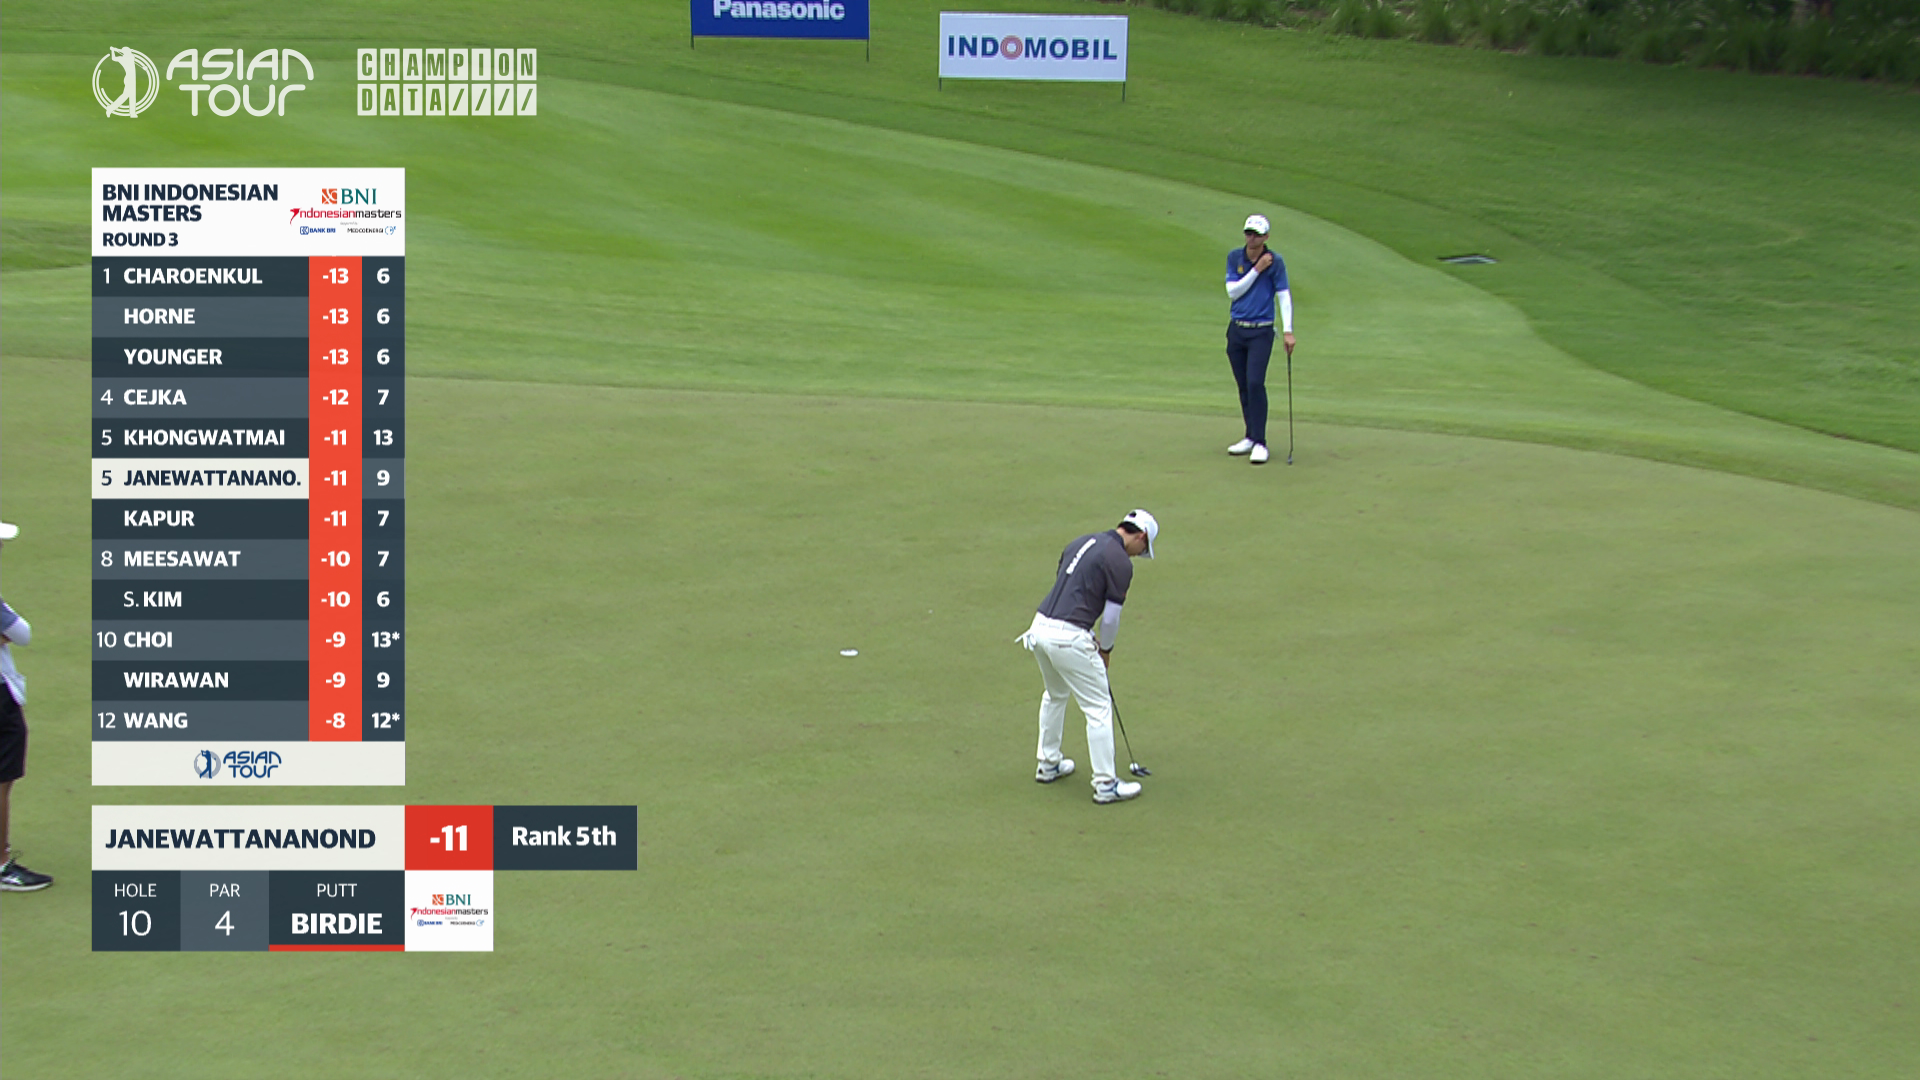
The main hero piece to this was the first ‘live leaderboard’ used in golf broadcasting, which could display the top scorers, and be left up during coverage.
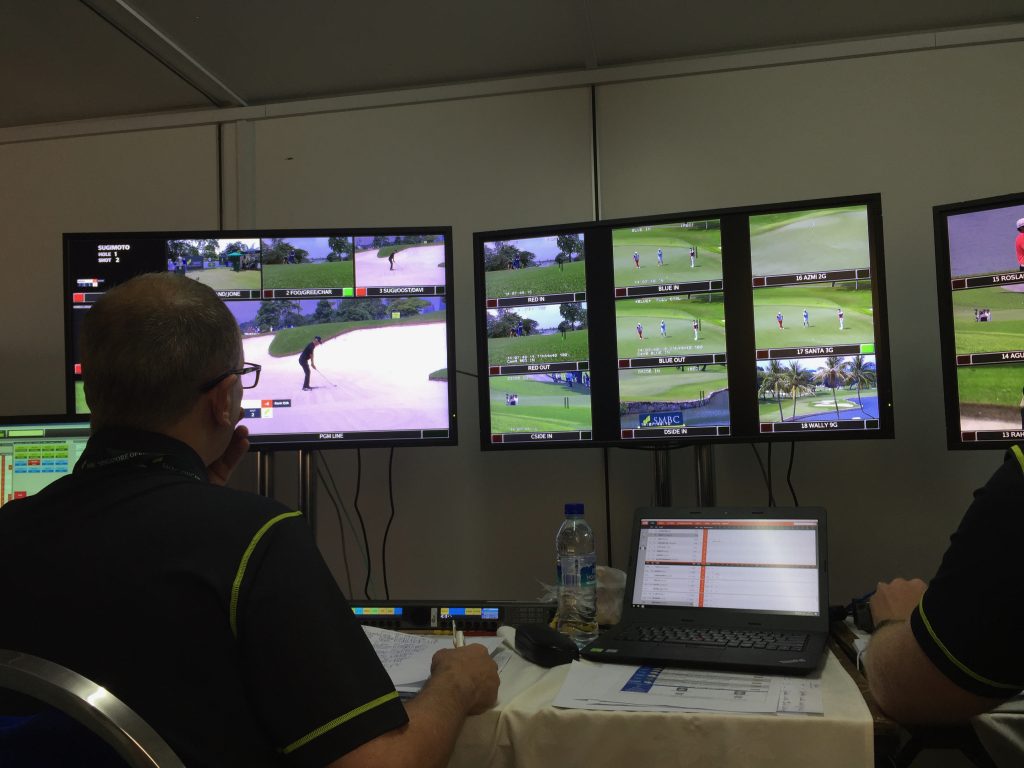
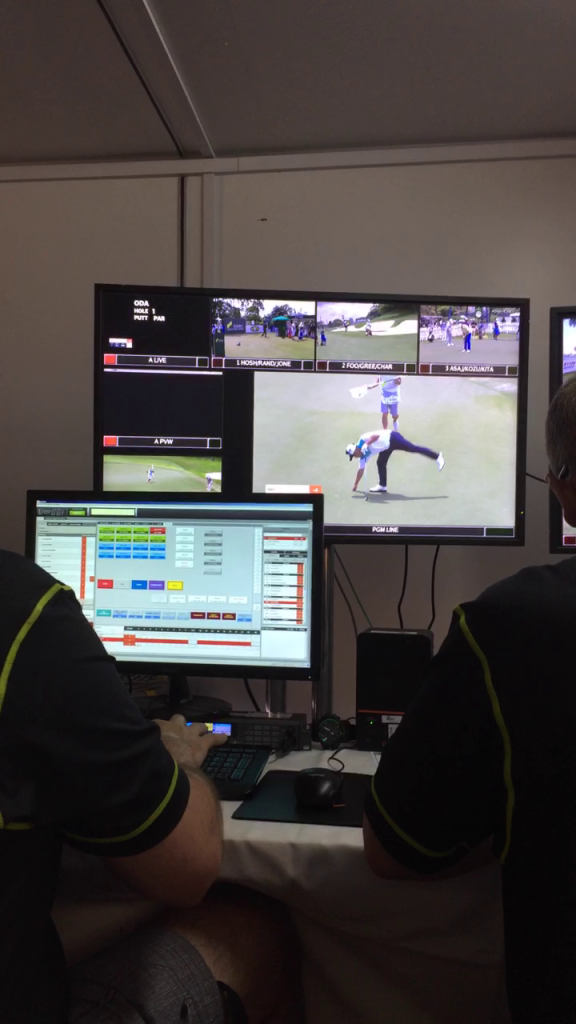
For myself, there was a lot learnt from building this package, as well as a lot of technical challenges.
I had to develop quite a lot of custom scripting in Viz for the leaderboard to work seamlessly, as well as to help automatically rotate sponsor logos across the full frame and lower third graphics, and adapt graphics to use the preferred display names of players, depending on their individual cultural backgrounds.